## Heatmap: Color Distribution Grid
### Overview
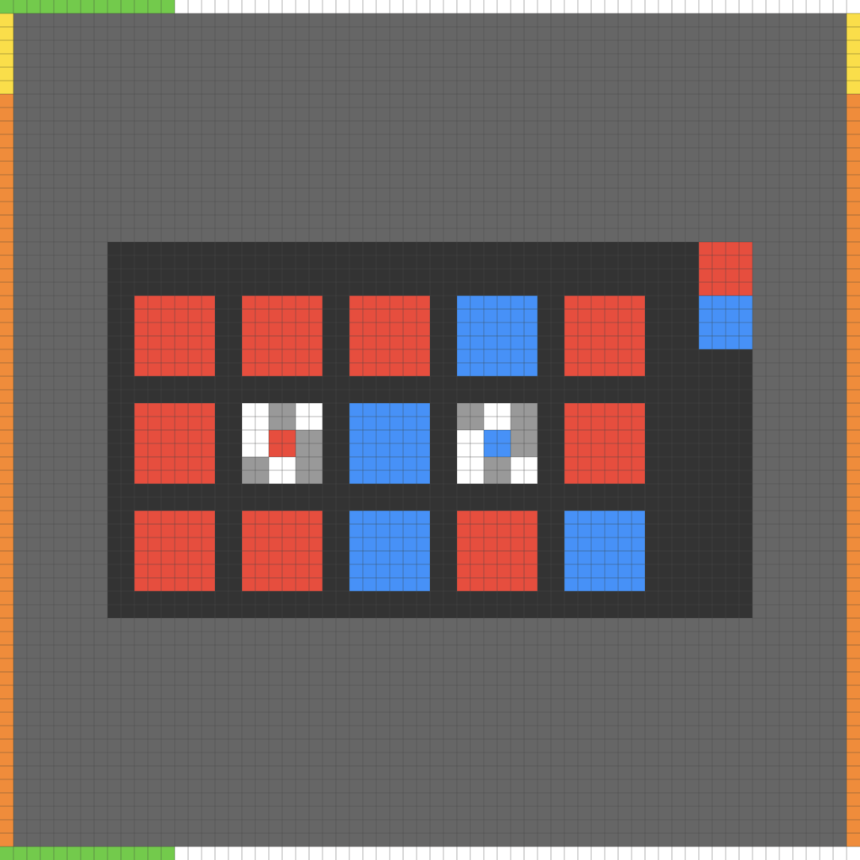
The image depicts a 3x3 grid of colored squares (red, blue, gray) with a legend on the right. The grid is bordered in black, and the background is a uniform gray. The legend categorizes the colors with labels, and the grid contains a mix of solid and nested patterns.
### Components/Axes
- **Legend**:
- **Red**: Solid red squares.
- **Blue**: Solid blue squares.
- **Gray**: Nested gray squares (with smaller squares inside).
- **Grid Structure**:
- 3 rows × 3 columns = 9 cells.
- Each cell contains a single colored square (except the center cell, which has a nested pattern).
- **Background**: Uniform gray with a black border.
### Detailed Analysis
- **Color Distribution**:
- **Red**: 15 squares (7 in the first row, 5 in the second row, 3 in the third row).
- **Blue**: 5 squares (1 in the first row, 2 in the second row, 2 in the third row).
- **Gray**: 2 squares (both in the second row, center cell).
- **Pattern Details**:
- The center cell (row 2, column 2) contains a nested gray square with a smaller red square inside.
- The top-right cell (row 1, column 3) contains a nested gray square with a smaller blue square inside.
- **Legend Placement**: Positioned to the right of the grid, aligned vertically.
### Key Observations
1. **Dominance of Red**: Red squares occupy the majority of the grid (70% of total cells).
2. **Nested Patterns**: Only two cells (center and top-right) feature nested squares, suggesting a hierarchical or sub-category relationship.
3. **Color Symmetry**: Blue and gray squares are less frequent but strategically placed to balance the grid.
### Interpretation
The image likely represents a simplified data visualization where colors denote categories (e.g., status, priority, or type). The nested patterns in gray squares may indicate sub-categories or conditional states (e.g., "in progress" vs. "completed"). The high prevalence of red suggests it is the primary category, while blue and gray serve as secondary or tertiary classifications. The lack of textual labels or numerical values implies the image is a conceptual or abstract representation rather than a data-driven chart.
## Notes
- No textual labels, axis titles, or numerical data are present in the image.
- The grid’s structure and color distribution are the sole sources of information.
- The nested patterns in gray squares are the only deviation from the solid-color cells.