## Line Chart: Accuracy vs. Time with Varying Parameters
### Overview
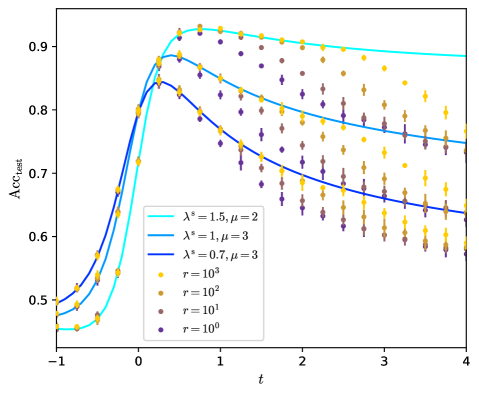
The image is a line chart displaying the relationship between test accuracy (Acc_test) and time (t) for different parameter settings. The chart includes three lines representing different values of lambda (λ) and mu (µ), and scattered data points representing different values of 'r'. Error bars are present on the scattered data points.
### Components/Axes
* **Y-axis (Vertical):** Acc_test (Test Accuracy). Scale ranges from 0.5 to 0.9, with tick marks at 0.5, 0.6, 0.7, 0.8, and 0.9.
* **X-axis (Horizontal):** t (Time). Scale ranges from -1 to 4, with tick marks at -1, 0, 1, 2, 3, and 4.
* **Legend (Left Side):**
* Cyan line: λ^s = 1.5, µ = 2
* Blue line: λ^s = 1, µ = 3
* Dark Blue line: λ^s = 0.7, µ = 3
* Yellow dots: r = 10^3
* Orange dots: r = 10^2
* Brown dots: r = 10^1
* Purple dots: r = 10^0
### Detailed Analysis
**Line Plots:**
* **Cyan Line (λ^s = 1.5, µ = 2):** Starts at approximately 0.47 at t = -1, increases sharply to approximately 0.85 at t = 0, peaks at approximately 0.94 around t = 1, and then gradually decreases to approximately 0.88 at t = 4.
* **Blue Line (λ^s = 1, µ = 3):** Starts at approximately 0.47 at t = -1, increases sharply to approximately 0.82 at t = 0, peaks at approximately 0.89 around t = 1, and then gradually decreases to approximately 0.75 at t = 4.
* **Dark Blue Line (λ^s = 0.7, µ = 3):** Starts at approximately 0.47 at t = -1, increases sharply to approximately 0.78 at t = 0, peaks at approximately 0.84 around t = 1, and then gradually decreases to approximately 0.64 at t = 4.
**Scatter Plots:**
The scatter plots show the test accuracy for different values of 'r' at various time points. Each data point has an associated error bar.
* **Yellow Dots (r = 10^3):** The accuracy starts high and decreases over time. At t=1, the accuracy is approximately 0.88, decreasing to approximately 0.75 at t=4.
* **Orange Dots (r = 10^2):** The accuracy starts high and decreases over time. At t=1, the accuracy is approximately 0.84, decreasing to approximately 0.68 at t=4.
* **Brown Dots (r = 10^1):** The accuracy starts high and decreases over time. At t=1, the accuracy is approximately 0.80, decreasing to approximately 0.60 at t=4.
* **Purple Dots (r = 10^0):** The accuracy starts high and decreases over time. At t=1, the accuracy is approximately 0.75, decreasing to approximately 0.55 at t=4.
### Key Observations
* The lines representing different λ^s and µ values all exhibit a similar trend: a rapid increase in accuracy followed by a gradual decrease.
* Higher values of λ^s appear to result in higher peak accuracy.
* The scattered data points for different 'r' values show a decreasing trend in accuracy as time increases.
* Higher values of 'r' generally correspond to higher accuracy at any given time point.
* The error bars on the scattered data points indicate the variability in the accuracy measurements.
### Interpretation
The chart illustrates the impact of different parameters (λ^s, µ, and r) on the test accuracy of a model over time. The lines suggest that the model's performance initially improves rapidly but then degrades as time progresses, possibly due to overfitting or other factors. The parameter λ^s seems to influence the peak performance, while 'r' affects the overall accuracy level. The decreasing trend in accuracy for different 'r' values suggests that the model's ability to generalize to new data diminishes over time. The error bars provide a measure of the uncertainty associated with the accuracy measurements for different 'r' values.