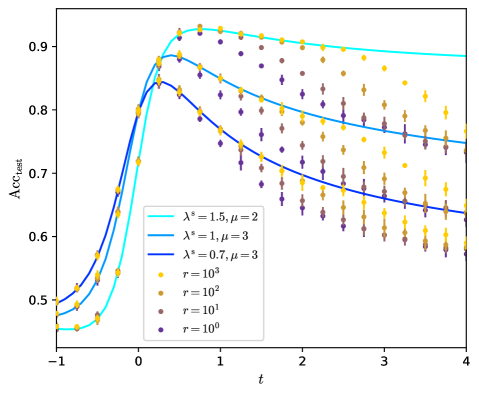
## Line Chart: Accuracy vs. Time
### Overview
The image presents a line chart illustrating the relationship between accuracy (Acc<sub>test</sub>) and time (t) under different parameter settings. The chart displays four distinct lines, each representing a unique combination of λ<sup>*</sup> and μ, or a specific value of r. Error bars are present for each data point, indicating variability.
### Components/Axes
* **X-axis:** Labeled "t", ranging from approximately -1 to 4.
* **Y-axis:** Labeled "Acc<sub>test</sub>", ranging from approximately 0.5 to 0.95.
* **Legend:** Located in the bottom-left corner, containing the following entries:
* λ<sup>*</sup> = 1.5, μ = 2 (Light Blue)
* λ<sup>*</sup> = 1, μ = 3 (Blue)
* λ<sup>*</sup> = 0.7, μ = 3 (Dark Blue)
* r = 10<sup>3</sup> (Yellow)
* r = 10<sup>2</sup> (Orange)
* r = 10<sup>1</sup> (Brown)
* r = 10<sup>0</sup> (Purple)
### Detailed Analysis
* **λ<sup>*</sup> = 1.5, μ = 2 (Light Blue):** This line starts at approximately 0.52 at t = -1, rapidly increases to a peak of around 0.93 at t = 0, and then gradually plateaus around 0.91 between t = 1 and t = 4. Error bars are small.
* **λ<sup>*</sup> = 1, μ = 3 (Blue):** This line begins at approximately 0.53 at t = -1, increases quickly to a peak of around 0.92 at t = 0, and then slowly declines to approximately 0.86 at t = 4. Error bars are small.
* **λ<sup>*</sup> = 0.7, μ = 3 (Dark Blue):** This line starts at approximately 0.51 at t = -1, rises to a peak of around 0.88 at t = 0, and then steadily decreases to approximately 0.74 at t = 4. Error bars are moderate.
* **r = 10<sup>3</sup> (Yellow):** This line starts at approximately 0.53 at t = -1, increases to a peak of around 0.92 at t = 0, and then gradually declines to approximately 0.88 at t = 4. Error bars are large.
* **r = 10<sup>2</sup> (Orange):** This line starts at approximately 0.52 at t = -1, increases to a peak of around 0.91 at t = 0, and then gradually declines to approximately 0.83 at t = 4. Error bars are large.
* **r = 10<sup>1</sup> (Brown):** This line starts at approximately 0.51 at t = -1, increases to a peak of around 0.87 at t = 0, and then gradually declines to approximately 0.78 at t = 4. Error bars are large.
* **r = 10<sup>0</sup> (Purple):** This line starts at approximately 0.50 at t = -1, increases to a peak of around 0.84 at t = 0, and then gradually declines to approximately 0.70 at t = 4. Error bars are large.
### Key Observations
* The lines representing different λ<sup>*</sup> and μ combinations exhibit a rapid initial increase in accuracy, followed by a plateau or gradual decline.
* The lines representing different 'r' values show a similar initial increase, but a more consistent decline over time.
* The error bars are significantly larger for the 'r' values compared to the λ<sup>*</sup> and μ combinations, indicating greater variability in accuracy for different 'r' values.
* The highest accuracy is consistently achieved by the lines representing λ<sup>*</sup> = 1.5, μ = 2 and λ<sup>*</sup> = 1, μ = 3, particularly in the initial stages.
### Interpretation
The chart likely represents the performance of a model or algorithm over time, with λ<sup>*</sup> and μ representing parameters influencing learning or adaptation, and 'r' representing a different parameter set. The initial rapid increase in accuracy suggests a period of fast learning or adaptation. The subsequent plateau or decline could indicate convergence, overfitting, or the influence of other factors. The larger error bars for the 'r' values suggest that the accuracy is more sensitive to variations in 'r' than in λ<sup>*</sup> and μ. The consistent decline in accuracy for the 'r' values might indicate a form of decay or instability. The data suggests that the parameter combinations λ<sup>*</sup> = 1.5, μ = 2 and λ<sup>*</sup> = 1, μ = 3 lead to better and more stable performance than the tested 'r' values. The chart provides insights into the sensitivity of the model's performance to different parameter settings and highlights the importance of choosing appropriate parameter values for optimal results.