\n
## Bar Chart: Process Error Rate by Dataset
### Overview
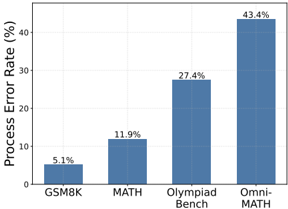
The image presents a bar chart illustrating the process error rate (in percentage) for four different datasets: GSM8K, MATH, Olympiad Bench, and OmniMATH. The error rates are represented by the height of the bars.
### Components/Axes
* **X-axis:** Represents the datasets: GSM8K, MATH, Olympiad Bench, and OmniMATH.
* **Y-axis:** Represents the Process Error Rate (%), ranging from 0% to 50% with increments of 10%.
* **Bars:** Each bar corresponds to a dataset, and its height indicates the process error rate.
* **Labels:** Each bar is labeled with the dataset name and the corresponding error rate percentage.
### Detailed Analysis
The chart displays the following data points:
* **GSM8K:** The bar for GSM8K is the shortest, reaching approximately 5.1%. The bar is positioned on the left-most side of the chart.
* **MATH:** The bar for MATH is taller than GSM8K, reaching approximately 11.9%. It is positioned to the right of GSM8K.
* **Olympiad Bench:** The bar for Olympiad Bench is significantly taller than MATH, reaching approximately 27.4%. It is positioned to the right of MATH.
* **OmniMATH:** The bar for OmniMATH is the tallest, reaching approximately 43.4%. It is positioned on the right-most side of the chart.
The trend is a clear upward slope, with the error rate increasing as we move from GSM8K to OmniMATH.
### Key Observations
* The process error rate varies significantly across the datasets.
* OmniMATH has the highest process error rate, more than eight times higher than GSM8K.
* GSM8K has the lowest process error rate.
* The error rate increases substantially from MATH to Olympiad Bench.
### Interpretation
The data suggests that the process used is more prone to errors when applied to the OmniMATH dataset compared to the other three. This could be due to the complexity of the problems within OmniMATH, the nature of the data itself, or limitations in the process being evaluated. The relatively low error rate for GSM8K suggests the process performs well on that type of data. The jump in error rate between MATH and Olympiad Bench indicates a shift in difficulty or characteristics of the problems.
The chart provides a comparative analysis of the process's performance across different datasets, highlighting areas where improvement may be needed. It is important to understand the characteristics of each dataset to determine the root cause of the varying error rates. For example, OmniMATH might contain more ambiguous or complex problems, requiring a more sophisticated process to achieve acceptable accuracy.