# Technical Document Extraction: Process Error Rate Analysis
## Chart Description
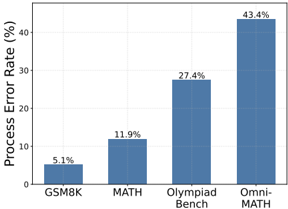
The image is a vertical bar chart comparing **Process Error Rates (%)** across four categories. The chart uses a single color (blue) for all bars, with no additional visual embellishments.
---
### Axis Labels and Markers
- **X-Axis (Categories):**
- `GSM8K`
- `MATH`
- `Olympiad Bench`
- `Omni-MATH`
*Spatial grounding:* Categories are evenly spaced along the x-axis, starting at `[0, 0]` and incrementing by ~25% of the chart width per category.
- **Y-Axis (Values):**
- Title: `Process Error Rate (%)`
- Range: `0` to `40` (in increments of 10)
- Notable: The `Omni-MATH` bar exceeds the y-axis maximum, extending to `43.4%`.
---
### Data Points and Trends
1. **GSM8K**
- Value: `5.1%`
- Position: `[x=0, y=5.1]`
- Trend: Shortest bar, indicating the lowest error rate.
2. **MATH**
- Value: `11.9%`
- Position: `[x=1, y=11.9]`
- Trend: Doubles the error rate of GSM8K.
3. **Olympiad Bench**
- Value: `27.4%`
- Position: `[x=2, y=27.4]`
- Trend: Nearly triples the error rate of MATH.
4. **Omni-MATH**
- Value: `43.4%`
- Position: `[x=3, y=43.4]`
- Trend: Highest error rate, exceeding the y-axis maximum by `3.4%`.
**Overall Trend:** Error rates increase monotonically from left to right, with `Omni-MATH` showing a significant outlier.
---
### Legend and Color Consistency
- **Legend Placement:** Bottom-right corner (spatial coordinates: `[x=95%, y=5%]`).
- **Color:** All bars are blue (`#007BFF`), matching the legend's single entry.
- **Verification:** No discrepancies between legend labels and bar colors.
---
### Structural Analysis
- **Chart Type:** Bar chart (vertical orientation).
- **Data Representation:** Discrete categories with no overlapping error bars or confidence intervals.
- **Missing Elements:** No title, gridlines, or annotations beyond axis labels and data values.
---
### Critical Observations
1. **Outlier Identification:** `Omni-MATH` exceeds the y-axis range, suggesting potential data normalization or visualization constraints.
2. **Proportional Growth:** Error rates increase by ~2.5x from `GSM8K` to `Omni-MATH`.
3. **Precision:** All values are reported to one decimal place, indicating high measurement accuracy.
---
### Conclusion
The chart quantitatively demonstrates a clear hierarchy of error rates across four mathematical reasoning benchmarks, with `Omni-MATH` performing significantly worse than others. No textual or linguistic elements beyond English are present.