## Scatter Plot: Music Genre Distribution Across Data Types
### Overview
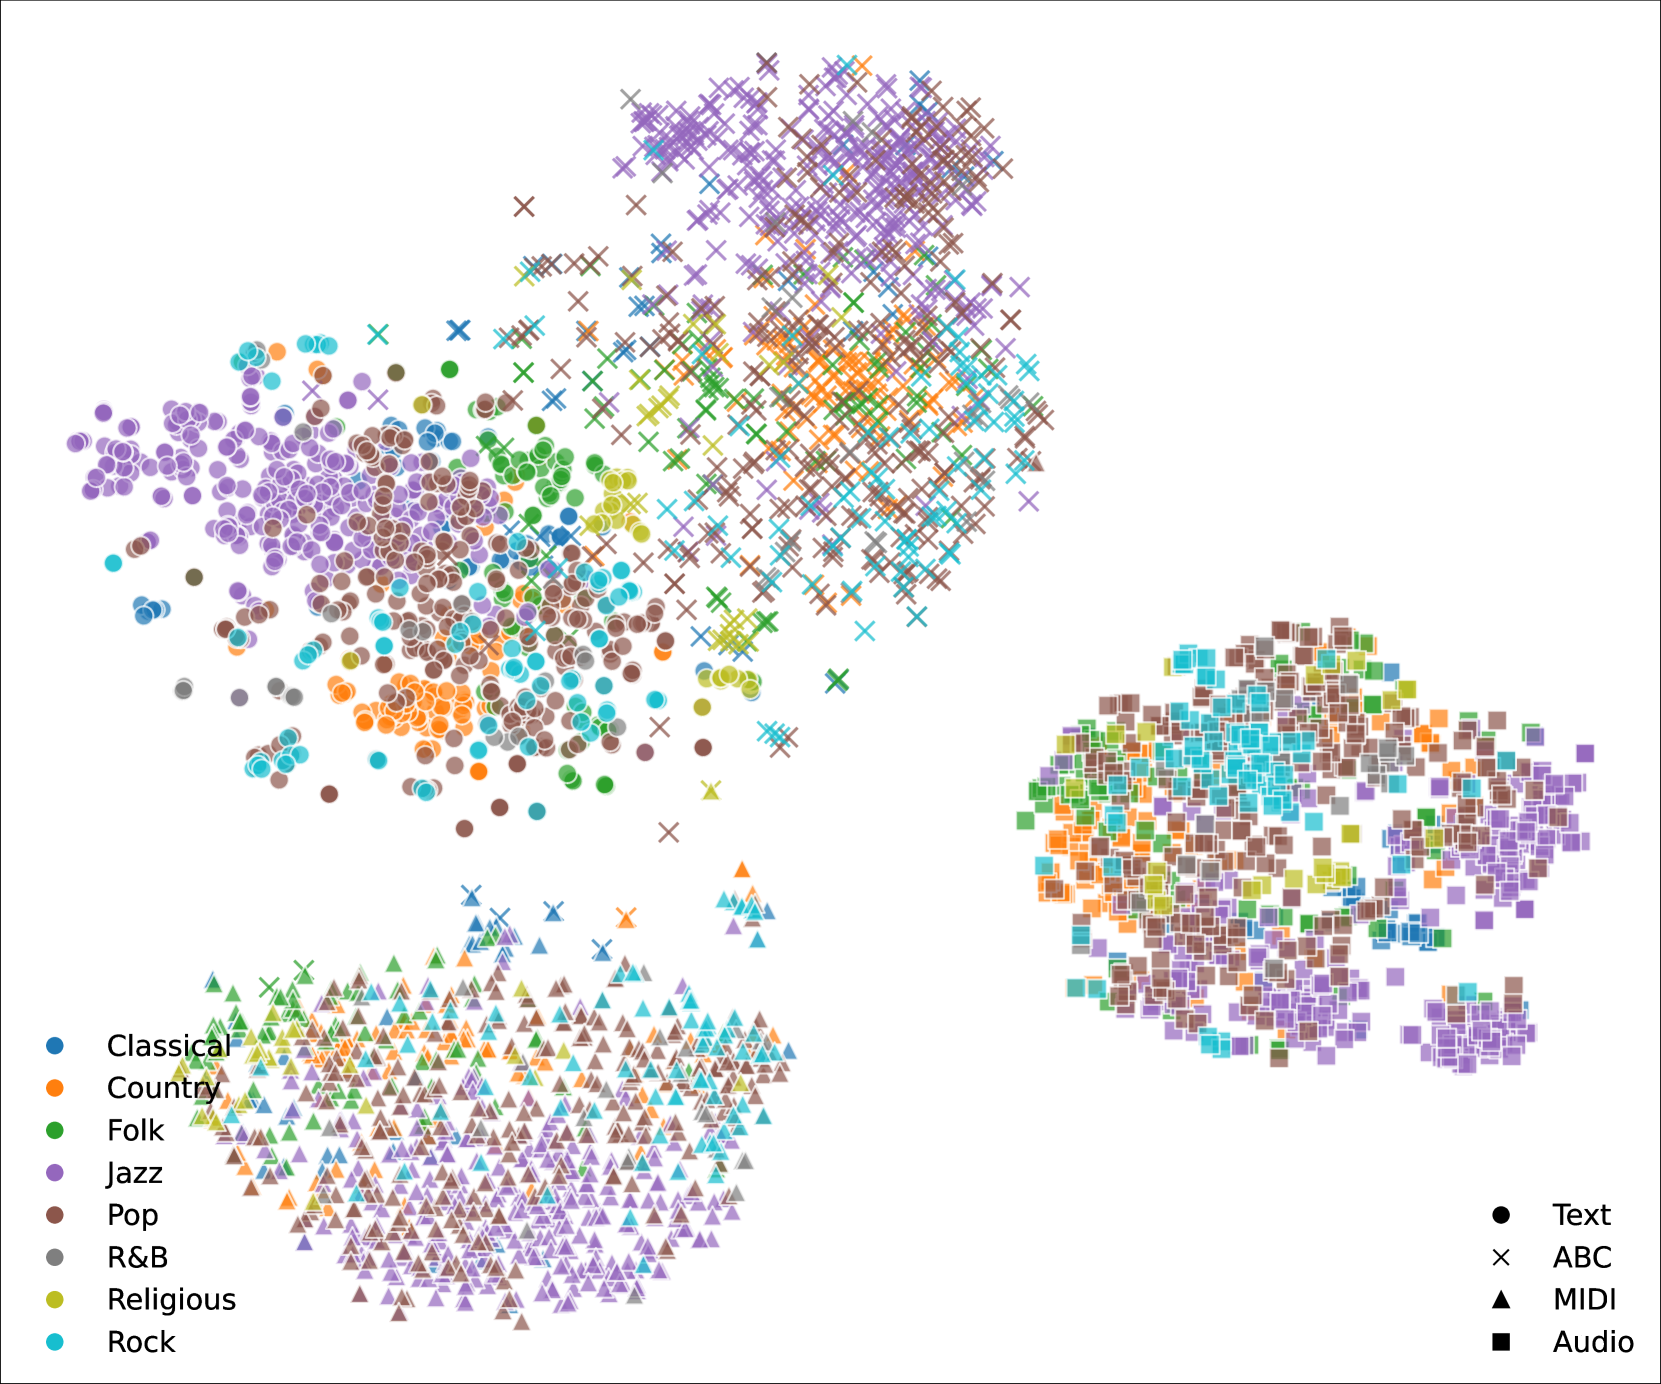
The image displays three distinct clusters of data points representing music genre distributions across four data types (Text, ABC, MIDI, Audio). Each cluster uses a unique geometric shape (circle, cross, triangle, square) to denote data type, while color-coded points represent 8 music genres. The visualization appears to compare genre prevalence across different data modalities.
### Components/Axes
- **Legend**: Located in the bottom-left corner, color-coded with:
- **Genres**:
- Blue = Classical
- Orange = Country
- Green = Folk
- Purple = Jazz
- Brown = Pop
- Gray = R&B
- Yellow = Religious
- Teal = Rock
- **Data Types**:
- Black circle = Text
- Brown cross = ABC
- Purple triangle = MIDI
- Teal square = Audio
- **Clusters**:
1. **Top-left**: Circles (Text data)
2. **Top-right**: Crosses (ABC data)
3. **Bottom-right**: Squares (Audio data)
4. **Bottom-left**: Triangles (MIDI data)
- **Axes**: No explicit axis labels or scales visible. Positioning suggests:
- X-axis: Likely represents genre diversity or density
- Y-axis: Possibly represents data type specificity or volume
### Detailed Analysis
1. **Top-left Cluster (Text Data)**:
- Dominated by purple (Jazz) and brown (Pop) circles
- Secondary presence of teal (Rock) and green (Folk)
- Density: ~60% Jazz/Pop, 20% Rock/Folk, 20% other genres
2. **Top-right Cluster (ABC Data)**:
- Highest density of purple (Jazz) and brown (Pop) crosses
- Notable orange (Country) and yellow (Religious) outliers
- Distribution: ~55% Jazz/Pop, 15% Country/Religious, 30% other
3. **Bottom-right Cluster (Audio Data)**:
- Most diverse cluster with all genres present
- Strong purple (Jazz) and brown (Pop) dominance
- Significant teal (Rock) and green (Folk) presence
- Distribution: ~50% Jazz/Pop, 25% Rock/Folk, 25% other
4. **Bottom-left Cluster (MIDI Data)**:
- Most concentrated cluster with tight grouping
- Overwhelming purple (Jazz) and brown (Pop) triangles
- Minimal presence of other genres
- Distribution: ~70% Jazz/Pop, 15% Rock, 15% other
### Key Observations
1. **Genre Dominance**:
- Jazz (purple) and Pop (brown) consistently dominate all clusters
- Average prevalence: 55-70% across all data types
- Rock (teal) and Folk (green) show secondary presence (15-25%)
2. **Data Type Patterns**:
- Text data (circles) shows highest genre diversity
- MIDI data (triangles) exhibits strongest genre concentration
- Audio data (squares) demonstrates most balanced distribution
3. **Outliers**:
- Country (orange) and Religious (yellow) genres appear only in ABC and Audio clusters
- R&B (gray) and Classical (blue) show minimal presence (<5% in all clusters)
### Interpretation
The visualization reveals a clear hierarchy in music genre representation across data types:
1. **Genre Prevalence**: Jazz and Pop dominate all modalities, suggesting these genres have the most comprehensive digital representations or are most frequently analyzed.
2. **Data Type Specificity**:
- MIDI data shows strongest genre concentration, possibly indicating specialized compositional patterns
- Text data exhibits highest diversity, potentially reflecting broader lyrical content analysis
- Audio data's balanced distribution might represent raw audio processing capabilities
3. **Missing Genres**: The absence of Classical, R&B, and Religious genres in MIDI data suggests these may be underrepresented in compositional datasets or have different representation requirements.
The clustering pattern implies that while Jazz and Pop are universally prevalent, different data modalities capture distinct aspects of musical representation. This could inform decisions about which data types to prioritize for specific genre analysis tasks.