## Chart: Test Error vs. Alpha for ReLU and ELU Activation Functions
### Overview
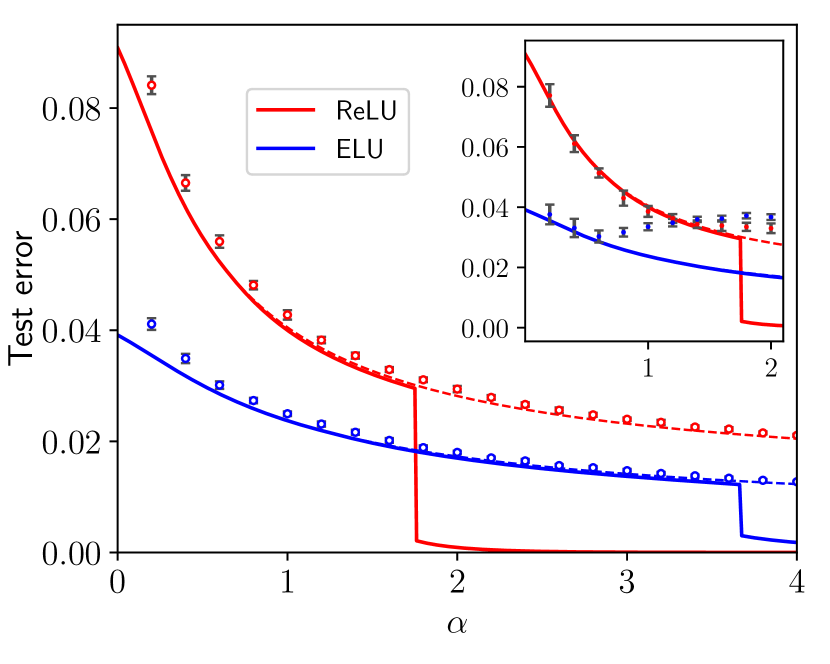
The image is a line chart comparing the test error of ReLU and ELU activation functions as a function of a parameter alpha. The chart includes an inset providing a zoomed-in view of the data for smaller alpha values. The main chart spans alpha values from 0 to 4, while the inset focuses on alpha values from approximately 0 to 2.
### Components/Axes
* **X-axis (Horizontal):** Labeled "α" (alpha). The main chart ranges from 0 to 4, with tick marks at each integer value. The inset chart ranges from approximately 0 to 2, with tick marks at 0, 1, and 2.
* **Y-axis (Vertical):** Labeled "Test error". The main chart ranges from 0.00 to 0.08, with tick marks at intervals of 0.02. The inset chart ranges from 0.00 to 0.08, with tick marks at intervals of 0.02.
* **Legend (Top-Left):**
* **Red Line:** ReLU
* **Blue Line:** ELU
* **Data Series:**
* **ReLU (Red):** A red line representing the test error for the ReLU activation function.
* **ELU (Blue):** A blue line representing the test error for the ELU activation function.
* **Dashed Red Line:** Dashed red line representing the test error for the ReLU activation function.
* **Dashed Blue Line:** Dashed blue line representing the test error for the ELU activation function.
### Detailed Analysis
**ReLU (Red Line):**
* **Trend:** The red line starts at approximately 0.085 at alpha = 0 and decreases rapidly until alpha is approximately 2. After alpha = 2, the line drops sharply to approximately 0.00 and remains at that level.
* **Data Points:**
* Alpha = 0: Test error ≈ 0.085
* Alpha = 1: Test error ≈ 0.05
* Alpha = 2: Test error ≈ 0.04
* Alpha > 2: Test error ≈ 0.00
**ELU (Blue Line):**
* **Trend:** The blue line starts at approximately 0.04 at alpha = 0 and decreases gradually until alpha is approximately 3.75. After alpha = 3.75, the line drops sharply to approximately 0.01 and remains at that level.
* **Data Points:**
* Alpha = 0: Test error ≈ 0.04
* Alpha = 1: Test error ≈ 0.025
* Alpha = 2: Test error ≈ 0.02
* Alpha = 3.75: Test error ≈ 0.015
* Alpha > 3.75: Test error ≈ 0.01
**Dashed ReLU (Dashed Red Line):**
* **Trend:** The dashed red line starts at approximately 0.085 at alpha = 0 and decreases rapidly until alpha is approximately 2. After alpha = 2, the line continues to decrease gradually.
* **Data Points:**
* Alpha = 0: Test error ≈ 0.085
* Alpha = 1: Test error ≈ 0.045
* Alpha = 2: Test error ≈ 0.03
* Alpha = 3: Test error ≈ 0.025
* Alpha = 4: Test error ≈ 0.022
**Dashed ELU (Dashed Blue Line):**
* **Trend:** The dashed blue line starts at approximately 0.04 at alpha = 0 and decreases gradually.
* **Data Points:**
* Alpha = 0: Test error ≈ 0.04
* Alpha = 1: Test error ≈ 0.03
* Alpha = 2: Test error ≈ 0.025
* Alpha = 3: Test error ≈ 0.02
* Alpha = 4: Test error ≈ 0.015
### Key Observations
* For low alpha values (0-2), the ELU activation function consistently shows a lower test error than the ReLU activation function.
* Both ReLU and ELU exhibit a sharp drop in test error at specific alpha values (around 2 for ReLU and 3.75 for ELU).
* The inset provides a clearer view of the initial behavior of the test error for both activation functions at low alpha values.
* The dashed lines show a more gradual decrease in test error compared to the solid lines.
### Interpretation
The chart suggests that the choice of activation function (ReLU or ELU) and the parameter alpha significantly impact the test error of the model. ELU appears to perform better than ReLU for lower alpha values. The sharp drops in test error for both activation functions indicate critical alpha thresholds where the model's performance improves drastically. The dashed lines show a more gradual decrease in test error compared to the solid lines, suggesting a different model configuration or training regime. The data implies that careful tuning of alpha is crucial for optimizing model performance, and the optimal value may depend on the chosen activation function.