\n
## Chart: Test Error vs. Alpha for ReLU and ELU
### Overview
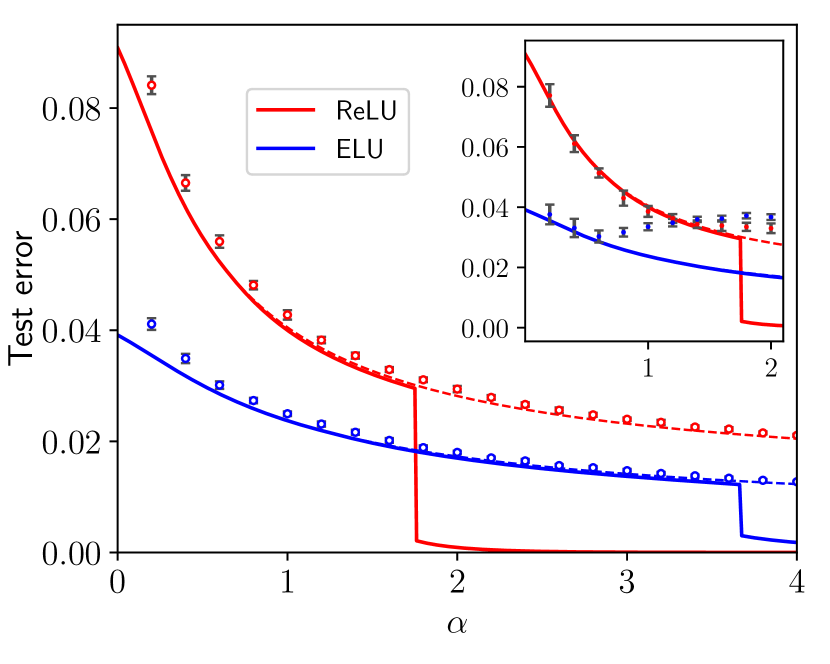
The image presents a line chart comparing the test error of two activation functions, ReLU (Rectified Linear Unit) and ELU (Exponential Linear Unit), as a function of a parameter α (alpha). The chart displays the test error on the y-axis and α on the x-axis. Error bars are included for each data point, representing the uncertainty or variance in the test error. A zoomed-in section of the chart is provided as an inset, focusing on the region where α ranges from 0 to approximately 2.
### Components/Axes
* **X-axis:** Labeled "α" (alpha), ranging from 0 to 4.
* **Y-axis:** Labeled "Test error", ranging from 0 to 0.08.
* **Legend:** Located in the top-right corner.
* "ReLU" - Represented by a solid red line.
* "ELU" - Represented by a solid blue line.
* **Data Points:** Represented by circular markers with error bars. Red circles correspond to ReLU, and blue squares correspond to ELU.
* **Inset Chart:** A zoomed-in view of the chart, focusing on the region from α = 0 to α = 2.
### Detailed Analysis
**ReLU (Red Line):**
The ReLU line starts at approximately 0.078 at α = 0, decreases rapidly to approximately 0.035 at α = 1, plateaus around 0.025 between α = 1 and α = 2, and then drops sharply to approximately 0.002 at α = 2. After α = 2, the line remains relatively constant at around 0.002 until α = 4.
* α = 0: Test error ≈ 0.078, Error bar extends to ≈ 0.082
* α = 0.5: Test error ≈ 0.052, Error bar extends to ≈ 0.056
* α = 1: Test error ≈ 0.035, Error bar extends to ≈ 0.038
* α = 1.5: Test error ≈ 0.027, Error bar extends to ≈ 0.030
* α = 2: Test error ≈ 0.002, Error bar extends to ≈ 0.004
* α = 3: Test error ≈ 0.002, Error bar extends to ≈ 0.003
* α = 4: Test error ≈ 0.002, Error bar extends to ≈ 0.003
**ELU (Blue Line):**
The ELU line starts at approximately 0.045 at α = 0, decreases steadily to approximately 0.015 at α = 1, continues to decrease to approximately 0.008 at α = 2, and then drops sharply to approximately 0.001 at α = 3 and remains constant at approximately 0.001 until α = 4.
* α = 0: Test error ≈ 0.045, Error bar extends to ≈ 0.048
* α = 0.5: Test error ≈ 0.030, Error bar extends to ≈ 0.033
* α = 1: Test error ≈ 0.015, Error bar extends to ≈ 0.017
* α = 1.5: Test error ≈ 0.011, Error bar extends to ≈ 0.013
* α = 2: Test error ≈ 0.008, Error bar extends to ≈ 0.010
* α = 3: Test error ≈ 0.001, Error bar extends to ≈ 0.002
* α = 4: Test error ≈ 0.001, Error bar extends to ≈ 0.002
**Inset Chart:**
The inset chart provides a magnified view of the initial portion of the curves, confirming the values and trends described above for α between 0 and 2.
### Key Observations
* Both ReLU and ELU exhibit decreasing test error as α increases, but the rate of decrease differs.
* ReLU shows a more dramatic drop in test error around α = 2, while ELU's decrease is more gradual.
* For α > 2, ReLU maintains a very low test error, while ELU continues to decrease slightly.
* The error bars indicate that the test error measurements have some variance, but the overall trends are clear.
### Interpretation
The chart demonstrates the impact of the α parameter on the performance of ReLU and ELU activation functions, as measured by test error. The results suggest that both activation functions benefit from increasing α, but ReLU experiences a more significant improvement in performance beyond α = 2. The sharp drop in ReLU's test error at α = 2 could indicate a critical threshold where the activation function begins to effectively mitigate certain types of errors. The inset chart highlights the initial behavior of the functions, showing that ELU initially outperforms ReLU, but ReLU catches up and surpasses ELU as α increases. The error bars suggest that the observed differences in performance are statistically significant, although further analysis would be needed to confirm this. The data suggests that for this specific task, ReLU may be a better choice than ELU when α is sufficiently large. The parameter α likely controls some aspect of the activation function's behavior, such as the slope of the linear portion or the scale of the exponential portion in the case of ELU.