## [Line Graph]: Test Error of ReLU vs. ELU Activation Functions as a Function of α
### Overview
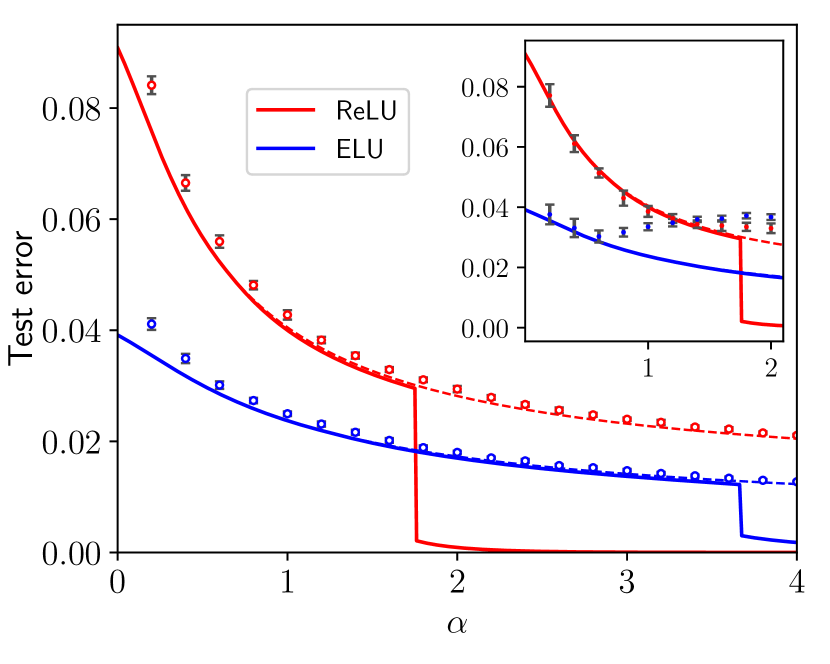
The image is a line graph comparing the **test error** of two neural network activation functions—**ReLU** (red) and **ELU** (blue)—as a function of the parameter \( \boldsymbol{\alpha} \) (alpha). An inset plot (top-right) provides a zoomed view of the region \( \alpha \approx 1 \) to \( 2 \) to clarify transition points.
### Components/Axes
- **Main Plot Axes**:
- **X-axis**: Labeled \( \boldsymbol{\alpha} \) (alpha), with ticks at \( 0, 1, 2, 3, 4 \).
- **Y-axis**: Labeled "Test error", with ticks at \( 0.00, 0.02, 0.04, 0.06, 0.08 \).
- **Legend**: Top-left, with two entries:
- "ReLU" (red line, square data points with error bars).
- "ELU" (blue line, circular data points with error bars).
- **Inset Plot (Top-Right)**:
- X-axis: Ticks at \( 1, 2 \) (zoomed \( \alpha \approx 1 \) to \( 2 \)).
- Y-axis: Ticks at \( 0.00, 0.02, 0.04, 0.06, 0.08 \) (same as main plot, but magnified).
### Detailed Analysis
#### Main Plot Trends:
- **ReLU (Red Line)**:
- Starts at \( \alpha = 0 \) with test error \( \approx 0.09 \) (above \( 0.08 \)).
- Decreases with \( \alpha \), with a **sharp step (drop)** at \( \alpha \approx 2 \) (error falls to near \( 0.00 \)).
- After \( \alpha = 2 \), error remains near \( 0.00 \) (flat line).
- Data points (red squares) follow the line, with vertical error bars (indicating variability).
- **ELU (Blue Line)**:
- Starts at \( \alpha = 0 \) with test error \( \approx 0.04 \) (lower than ReLU at \( \alpha = 0 \)).
- Decreases more gradually than ReLU, with a **smaller step (drop)** at \( \alpha \approx 3.5 \) (error falls to near \( 0.00 \)).
- After \( \alpha = 3.5 \), error remains near \( 0.00 \) (flat line).
- Data points (blue circles) follow the line, with vertical error bars.
#### Inset Plot (Zoomed Region \( \boldsymbol{\alpha \approx 1} \) to \( \boldsymbol{2} \)):
- **ReLU (Red)**:
- At \( \alpha = 1 \), error \( \approx 0.06 \); at \( \alpha = 2 \), error \( \approx 0.03 \) (before the sharp step).
- The line declines steeply in this interval, highlighting the transition before the major step at \( \alpha \approx 2 \).
- **ELU (Blue)**:
- At \( \alpha = 1 \), error \( \approx 0.03 \); at \( \alpha = 2 \), error \( \approx 0.02 \).
- The line declines more gradually than ReLU in this interval.
### Key Observations
1. **Initial Performance (Low \( \boldsymbol{\alpha} \))**:
- ELU outperforms ReLU (lower test error) for \( \alpha < 2 \). For example:
- At \( \alpha = 0 \): ReLU error \( \approx 0.09 \) vs. ELU \( \approx 0.04 \).
- At \( \alpha = 1 \): ReLU error \( \approx 0.04 \) vs. ELU \( \approx 0.025 \).
2. **Step-Like Transitions**:
- Both functions exhibit **abrupt drops (steps)** in test error at critical \( \alpha \) values:
- ReLU: Step at \( \alpha \approx 2 \) (error falls from \( \approx 0.03 \) to \( \approx 0.00 \)).
- ELU: Step at \( \alpha \approx 3.5 \) (error falls from \( \approx 0.015 \) to \( \approx 0.00 \)).
3. **Post-Step Performance**:
- After their respective steps, both functions approach near-zero test error. ReLU reaches near-zero earlier (at \( \alpha \approx 2 \)) than ELU (at \( \alpha \approx 4 \)).
### Interpretation
- **What the Data Suggests**: The graph compares how test error (a measure of model performance) changes with \( \alpha \) (a hyperparameter, e.g., network depth/width) for ReLU and ELU.
- **ReLU’s Behavior**: ReLU has higher initial error but benefits drastically from increasing \( \alpha \) up to \( 2 \), where a sharp improvement (step) occurs. After \( \alpha = 2 \), ReLU outperforms ELU until ELU’s step at \( \alpha \approx 3.5 \).
- **ELU’s Behavior**: ELU starts with lower error, decreases more gradually, and has a smaller step later. Its performance is more consistent but slower to improve.
- **Implications**: The step-like drops suggest **threshold effects** in \( \alpha \)—critical values where model performance improves drastically. ReLU is more sensitive to \( \alpha \) in the \( 0 \) to \( 2 \) range, while ELU’s improvement is sustained but slower. The inset clarifies the transition region, showing ReLU’s steeper decline before its major step.
This analysis captures all visible elements, trends, and interpretive insights, enabling reconstruction of the graph’s information without the image.