## Line Graph: Test Error vs. α for ReLU and ELU Activation Functions
### Overview
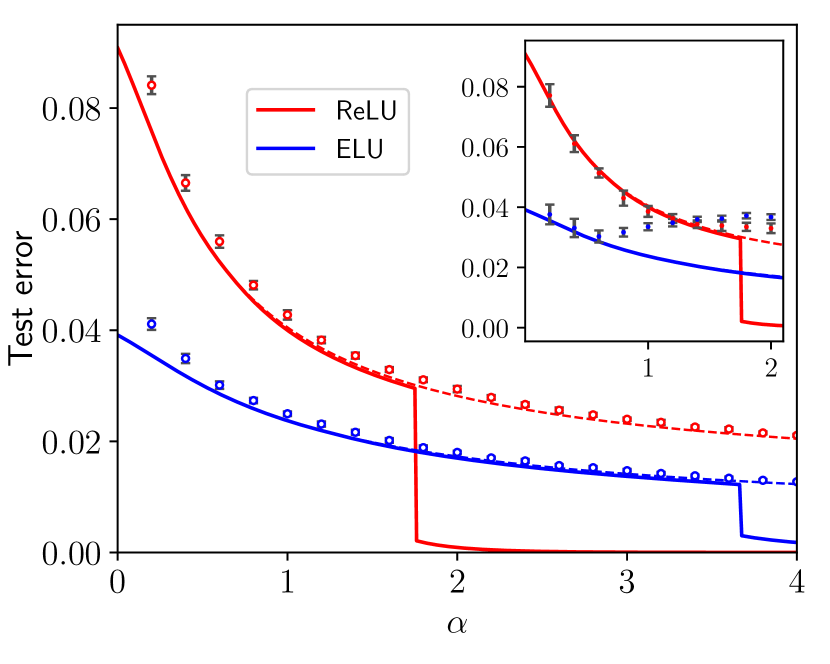
The graph compares the test error performance of two activation functions (ReLU and ELU) across different values of the hyperparameter α. Two lines are plotted: a red line for ReLU and a blue line for ELU. An inset graph provides a zoomed-in view of the region between α=1 and α=2.
### Components/Axes
- **X-axis (α)**: Ranges from 0 to 4, labeled "α".
- **Y-axis (Test error)**: Ranges from 0.00 to 0.08, labeled "Test error".
- **Legend**: Located in the top-right corner of the main graph, with:
- Red line: ReLU
- Blue line: ELU
- **Inset graph**: Positioned in the top-right corner of the main graph, focusing on α=1 to 2 with a reduced y-axis range (0.00 to 0.08).
### Detailed Analysis
1. **ReLU (Red Line)**:
- Starts at ~0.08 test error at α=0.
- Decreases sharply until α≈1.5, reaching ~0.02.
- Plateaus at α≥2, maintaining ~0.02 test error.
- Data points: Square markers with error bars (e.g., α=0: 0.08±0.005, α=2: 0.02±0.002).
2. **ELU (Blue Line)**:
- Starts at ~0.04 test error at α=0.
- Decreases gradually until α≈2, reaching ~0.015.
- Plateaus at α≥2, maintaining ~0.015 test error.
- Data points: Circular markers with error bars (e.g., α=0: 0.04±0.003, α=2: 0.015±0.001).
3. **Inset Graph**:
- Focuses on α=1 to 2.
- ReLU (red) and ELU (blue) converge near α=2, with overlapping error bars.
- Both lines show reduced variability in this range.
### Key Observations
- ReLU exhibits a steeper initial decline in test error compared to ELU.
- ELU demonstrates more gradual improvement but achieves lower test error at higher α values.
- Both activation functions plateau at α≥2, suggesting diminishing returns beyond this point.
- The inset confirms convergence of ReLU and ELU performance near α=2.
### Interpretation
The data suggests that ELU activation functions may offer better generalization (lower test error) than ReLU for α≥2, though both exhibit saturation effects. The sharp decline in ReLU’s performance at lower α values indicates sensitivity to hyperparameter tuning, while ELU’s gradual improvement implies greater stability. The convergence at α=2 implies that beyond this threshold, the choice between ReLU and ELU may have minimal impact on test error, though ELU’s lower baseline error could be advantageous in practice.