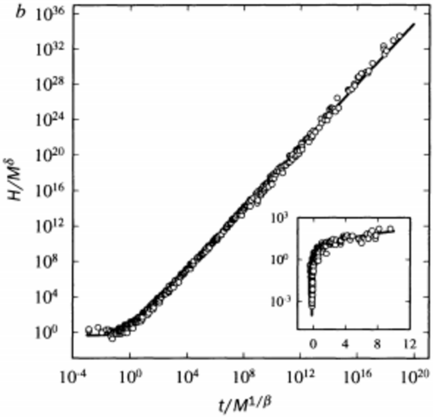
## Log-Log Plot: H/M^δ vs. t/M^(1/β)
### Overview
The image presents a log-log plot showing the relationship between two dimensionless quantities: H/M^δ (y-axis) and t/M^(1/β) (x-axis). The plot exhibits a linear trend on the log-log scale, suggesting a power-law relationship. An inset plot provides a closer view of the behavior at smaller values of t/M^(1/β).
### Components/Axes
* **Title:** There is no explicit title on the chart.
* **Y-axis:**
* Label: H/M^δ
* Scale: Logarithmic (base 10)
* Markers: 10^0, 10^4, 10^8, 10^12, 10^16, 10^20, 10^24, 10^28, 10^32, 10^36
* **X-axis:**
* Label: t/M^(1/β)
* Scale: Logarithmic (base 10)
* Markers: 10^-4, 10^0, 10^4, 10^8, 10^12, 10^16, 10^20
* **Data:**
* Scatter plot of data points (small circles)
* Solid line representing a fit to the data
* **Inset Plot:**
* X-axis: 0, 4, 8, 12 (linear scale)
* Y-axis: 10^-3, 10^-2, 10^-1, 10^0, 10^1 (logarithmic scale)
* Data: Scatter plot of data points (small circles) and a solid line representing a fit to the data.
### Detailed Analysis
* **Main Plot:**
* The data points (small circles) show a clear upward trend.
* The solid black line closely follows the data points, indicating a good fit.
* At very small values of t/M^(1/β) (around 10^-4 to 10^0), the data points are relatively flat, suggesting a constant value of H/M^δ.
* From t/M^(1/β) ≈ 10^0 to 10^20, the data points increase linearly on the log-log scale.
* **Inset Plot:**
* The inset plot shows the behavior of the data at small values of t/M^(1/β) on a semi-log scale.
* The data points initially decrease rapidly from approximately x = 0 to x = 1.
* The data points then increase rapidly from approximately x = 1 to x = 2.
* The data points then level off and approach a constant value for x > 4.
### Key Observations
* The main plot shows a power-law relationship between H/M^δ and t/M^(1/β) over a wide range of values.
* The inset plot reveals a more complex behavior at small values of t/M^(1/β), with an initial decrease followed by an increase and then a leveling off.
### Interpretation
The log-log plot suggests that H/M^δ is proportional to a power of t/M^(1/β) over a wide range. The inset plot indicates that this power-law relationship does not hold at very small values of t/M^(1/β), where other factors may be influencing the behavior of the system. The initial decrease in the inset plot could be due to some transient effect that is not captured by the power-law relationship. The leveling off at larger values in the inset suggests that the system is approaching a steady state. The plot demonstrates a scaling relationship between the variables, which is a common feature in many physical systems. The exponents δ and β likely represent critical exponents related to the underlying physics of the system.