## Chart: Log-Log Plot of H/Mδ vs. t/M¹/β
### Overview
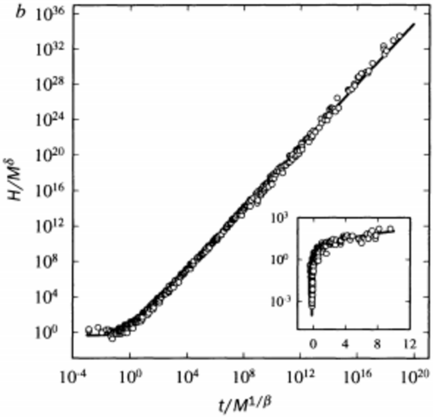
The image presents a log-log plot displaying the relationship between two variables: H/Mδ on the y-axis and t/M¹/β on the x-axis. The data is represented by a series of points connected by a line, exhibiting a generally linear trend on this log-log scale. A smaller inset plot is included in the top-right corner, showing a zoomed-in view of the data at lower values of both axes.
### Components/Axes
* **X-axis Label:** t/M¹/β
* **X-axis Scale:** Logarithmic, ranging from approximately 10⁻⁴ to 10²⁰.
* **Y-axis Label:** H/Mδ
* **Y-axis Scale:** Logarithmic, ranging from approximately 10⁰ to 10³⁶.
* **Data Series:** A single data series represented by numerous points connected by a line. The points are marked with small circles.
* **Inset Plot:** A smaller log-log plot in the top-right corner, with x-axis ranging from 0 to 12 and y-axis ranging from 10⁰ to 10³.
* **Label:** 'b' is present at the top-left of the y-axis.
### Detailed Analysis
The main plot shows a strong positive correlation between H/Mδ and t/M¹/β. The line representing the data series slopes upward, indicating that as t/M¹/β increases, H/Mδ also increases.
**Main Plot Data Points (Approximate):**
* At t/M¹/β ≈ 10⁻⁴, H/Mδ ≈ 10⁰ (1).
* At t/M¹/β ≈ 10⁰, H/Mδ ≈ 10⁴ (10,000).
* At t/M¹/β ≈ 10⁴, H/Mδ ≈ 10¹⁰ (10,000,000,000).
* At t/M¹/β ≈ 10⁸, H/Mδ ≈ 10¹⁸.
* At t/M¹/β ≈ 10¹², H/Mδ ≈ 10²⁶.
* At t/M¹/β ≈ 10¹⁶, H/Mδ ≈ 10³².
* At t/M¹/β ≈ 10²⁰, H/Mδ ≈ 10³⁶.
**Inset Plot Data Points (Approximate):**
* At t/M¹/β ≈ 1, H/Mδ ≈ 10¹ (10).
* At t/M¹/β ≈ 4, H/Mδ ≈ 10² (100).
* At t/M¹/β ≈ 8, H/Mδ ≈ 10³ (1,000).
* At t/M¹/β ≈ 12, H/Mδ ≈ 10³ (1,000).
The inset plot shows a more detailed view of the data at lower values, revealing a slightly curved initial segment before it appears to approach a linear trend.
### Key Observations
* The relationship between H/Mδ and t/M¹/β is approximately linear on a log-log scale, suggesting a power-law relationship.
* The inset plot highlights the behavior of the data at lower values, showing a possible deviation from the power-law behavior at very small t/M¹/β.
* The data spans several orders of magnitude on both axes.
### Interpretation
The plot suggests a scaling relationship between H and Mδ with respect to time t and parameters M and β. The approximate linearity on the log-log scale indicates that H/Mδ is proportional to t raised to some power (i.e., H/Mδ ≈ Ctⁿ, where C and n are constants). The inset plot suggests that this power-law relationship may not hold at very early times. The 'b' label near the y-axis could indicate a parameter or coefficient associated with the relationship, but its specific meaning is not clear without additional context. The data likely represents a physical process where H grows with time, and the scaling exponents reveal information about the underlying dynamics. The parameters M and β likely represent characteristic scales or exponents within the system being studied. Further analysis would be needed to determine the exact physical meaning of these variables and the power-law exponent.