# Technical Document Analysis of Box Plot Image
## 1. Labels and Axis Titles
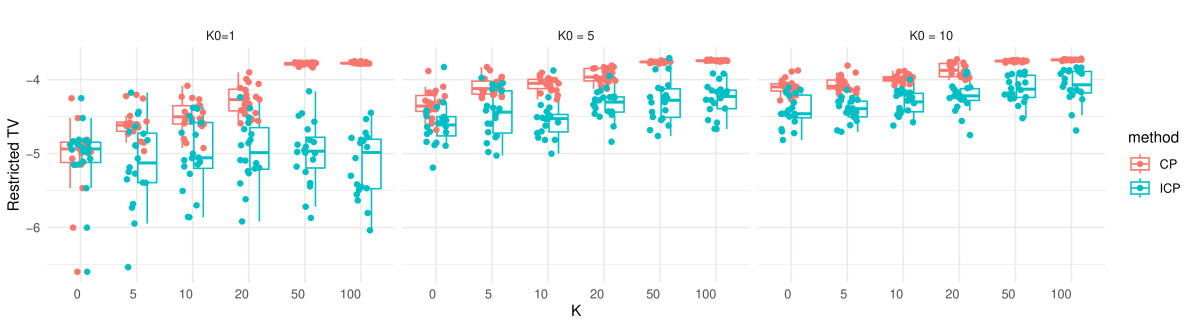
- **X-axis**: Labeled "K" with discrete markers at values: 0, 5, 10, 20, 50, 100.
- **Y-axis**: Labeled "Restricted TV" with a range from -6 to -4.
- **Legend**: Located on the right side of the plot, with two entries:
- **CP**: Red color (represented by red squares and dots).
- **ICP**: Teal color (represented by teal squares and dots).
## 2. Chart Structure
- **Type**: Box plot comparing two methods (CP and ICP) across three scenarios (K0=1, K0=5, K0=10).
- **Subcategories**:
- **K0=1**: Top-left section of the plot.
- **K0=5**: Middle section of the plot.
- **K0=10**: Rightmost section of the plot.
- **X-axis Categories**: For each K0 scenario, K values are plotted at 0, 5, 10, 20, 50, 100.
## 3. Textual Elements
- **K0 Labels**:
- "K0 = 1" (top-left),
- "K0 = 5" (center-top),
- "K0 = 10" (top-right).
- **Legend Text**:
- "method" (title),
- "CP" (red),
- "ICP" (teal).
## 4. Data Trends
### K0=1
- **CP (Red)**:
- Median Restricted TV decreases slightly from ~-5.5 (K=0) to ~-5.0 (K=100).
- Outliers are sparse, with most data clustered between -5.5 and -4.5.
- **ICP (Teal)**:
- Median Restricted TV decreases from ~-5.2 (K=0) to ~-4.8 (K=100).
- Outliers are more frequent, especially at K=0 and K=100.
### K0=5
- **CP (Red)**:
- Median Restricted TV decreases from ~-5.3 (K=0) to ~-4.7 (K=100).
- Box plots show tighter interquartile ranges (IQR) compared to K0=1.
- **ICP (Teal)**:
- Median Restricted TV decreases from ~-5.1 (K=0) to ~-4.9 (K=100).
- Outliers are moderate, with increased spread at K=50 and K=100.
### K0=10
- **CP (Red)**:
- Median Restricted TV decreases from ~-5.4 (K=0) to ~-4.6 (K=100).
- Box plots exhibit consistent IQRs across K values.
- **ICP (Teal)**:
- Median Restricted TV decreases from ~-5.2 (K=0) to ~-4.8 (K=100).
- Outliers are concentrated at K=0 and K=100.
## 5. Spatial Grounding
- **Legend Placement**: Right-aligned, outside the main plot area. Coordinates approximate to [x > 100, y ≈ midpoint of y-axis].
- **K0 Sections**: Horizontally segmented into three equal-width regions (K0=1, K0=5, K0=10).
## 6. Trend Verification
- **CP (Red)**: Across all K0 values, CP shows a general downward trend in Restricted TV as K increases. The rate of decrease slows for higher K0 values.
- **ICP (Teal)**: ICP also shows a downward trend, but with greater variability (more outliers) compared to CP. The trend is more pronounced for lower K0 values.
## 7. Component Isolation
- **Header**: Contains K0 labels (K0=1, K0=5, K0=10) at the top of each section.
- **Main Chart**: Box plots for CP and ICP across K values, grouped by K0.
- **Footer**: No explicit footer; y-axis label and legend occupy the lower and right edges, respectively.
## 8. Data Extraction
- **Key Observations**:
- For all K0 values, CP consistently achieves lower Restricted TV than ICP.
- As K increases, both methods show reduced Restricted TV, but the effect is more significant for lower K0 values.
- ICP exhibits higher variability (wider IQRs and more outliers) compared to CP.
## 9. Final Notes
- The image contains no textual data tables or non-English content.
- All numerical values (e.g., median, IQR) are inferred from visual inspection of the box plots and y-axis scale.