## Scatter Plot: formal_logic
### Overview
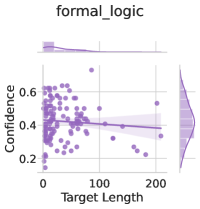
The image is a scatter plot titled "formal_logic". It displays the relationship between "Target Length" on the x-axis and "Confidence" on the y-axis. The plot includes a regression line with a shaded confidence interval, along with marginal distributions (histograms/density plots) for each variable along the axes.
### Components/Axes
* **Title:** formal\_logic
* **X-axis:** Target Length
* Scale ranges from 0 to 200, with tick marks at approximately 0, 100, and 200.
* **Y-axis:** Confidence
* Scale ranges from 0.2 to 0.6, with tick marks at approximately 0.2, 0.4, and 0.6.
* **Data Points:** Purple dots representing individual data points.
* **Regression Line:** A purple line showing the linear regression fit to the data.
* **Confidence Interval:** A shaded purple region around the regression line, representing the confidence interval.
* **Marginal Distributions:**
* Top: Density plot of Target Length.
* Right: Density plot of Confidence.
### Detailed Analysis
* **Target Length:** The x-axis represents the length of the target variable, ranging from 0 to 200.
* **Confidence:** The y-axis represents the confidence level, ranging from 0.2 to 0.6.
* **Data Point Distribution:** The data points are scattered across the plot. There is a higher concentration of points with lower target lengths (around 0-50) and a wider range of confidence values. As the target length increases, the density of points decreases, and the confidence values appear to be more tightly clustered around the regression line.
* **Regression Line:** The regression line has a slight negative slope, indicating a weak negative correlation between target length and confidence.
* **Confidence Interval:** The shaded region around the regression line indicates the uncertainty in the estimated relationship. The width of the interval suggests the variability in the data.
* **Marginal Distributions:**
* The density plot for Target Length shows a right-skewed distribution, indicating that most target lengths are relatively short, with a few longer target lengths.
* The density plot for Confidence shows a distribution centered around 0.4, with a slight skew towards lower confidence values.
### Key Observations
* There is a weak negative correlation between Target Length and Confidence.
* The majority of data points are concentrated at lower Target Length values.
* The Confidence values are more variable for shorter Target Lengths.
### Interpretation
The scatter plot suggests that as the target length increases, the confidence tends to slightly decrease. However, the relationship is weak, as indicated by the shallow slope of the regression line and the wide confidence interval. The concentration of data points at lower target lengths suggests that the model may be more reliable for shorter targets. The variability in confidence values for shorter target lengths could be due to other factors not captured in this plot. Overall, the plot indicates a limited relationship between target length and confidence in the "formal_logic" context.