## Scatter Plot with Violin Plot Overlay: Formal Logic Confidence vs. Target Length
### Overview
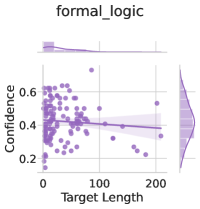
The image is a statistical visualization combining a scatter plot and a violin plot, titled "formal_logic". It displays the relationship between "Target Length" (x-axis) and "Confidence" (y-axis) for a dataset, likely from a machine learning or computational linguistics context. The plot suggests an analysis of model performance or prediction confidence as a function of input length.
### Components/Axes
* **Title:** "formal_logic" (centered at the top).
* **X-Axis:**
* **Label:** "Target Length"
* **Scale:** Linear, with major tick marks and labels at 0, 100, and 200.
* **Y-Axis:**
* **Label:** "Confidence"
* **Scale:** Linear, with major tick marks and labels at 0.2, 0.4, and 0.6.
* **Legend:** Located in the top-left corner of the plot area. It is partially obscured but appears to contain a single entry with a purple square symbol, corresponding to the scatter plot data points.
* **Data Series:**
1. **Scatter Plot:** Numerous purple circular data points distributed across the plot.
2. **Trend Line:** A solid purple line running through the scatter data, accompanied by a semi-transparent purple shaded region representing the confidence interval.
3. **Violin Plot:** A vertical, purple-shaded density plot positioned along the right edge of the chart area, showing the distribution of the "Confidence" values.
### Detailed Analysis
* **Scatter Plot Distribution:**
* Data points are densely clustered in the region where Target Length is between 0 and approximately 50.
* The density of points decreases as Target Length increases beyond 50.
* Confidence values for the majority of points range from approximately 0.25 to 0.55.
* There is one notable outlier point with a high Confidence value of approximately 0.65 at a low Target Length (near 0).
* **Trend Line:**
* The line exhibits a slight negative slope, starting at a Confidence of ~0.42 at Target Length 0 and descending to ~0.38 at Target Length 200.
* The shaded confidence interval around the trend line is relatively narrow, suggesting a statistically stable, though weak, negative correlation.
* **Violin Plot (Right Side):**
* This plot shows the univariate distribution of the "Confidence" variable.
* The widest part of the violin (indicating the highest density of data) is centered around a Confidence value of approximately 0.4.
* The distribution appears slightly skewed, with a longer tail extending towards lower Confidence values (down to ~0.2) and a shorter tail towards higher values (up to ~0.65).
### Key Observations
1. **Negative Correlation:** There is a clear, albeit weak, trend where increasing Target Length is associated with a slight decrease in Confidence.
2. **Data Density:** The vast majority of observations have a Target Length under 100, with very few data points beyond 150.
3. **Concentration of Confidence:** Most Confidence scores are concentrated in the 0.3 to 0.5 range, as evidenced by both the scatter cluster and the violin plot's bulge.
4. **High-Confidence Outlier:** A single data point shows exceptionally high confidence (~0.65) for a very short target length, which may warrant investigation as a special case or potential anomaly.
### Interpretation
This chart likely evaluates the performance of a formal logic reasoning system (e.g., a theorem prover, logic parser, or a language model on logical tasks). "Target Length" probably refers to the complexity or length of the logical statement/proof, while "Confidence" is the model's self-assessed probability of being correct.
The data suggests that the system's confidence in its outputs degrades marginally as the logical problems become longer or more complex. The high density of short-length targets indicates the evaluation dataset may be skewed towards simpler problems. The outlier with high confidence on a short target could represent a trivial or highly familiar logical pattern. The violin plot confirms that the system's confidence is generally moderate (centered at 0.4), rarely reaching high certainty (>0.6), which may reflect the inherent difficulty or ambiguity in the formal logic tasks presented. The weak negative trend implies that while length/complexity is a factor, other variables not shown (e.g., logical depth, rule types) likely play a more significant role in determining confidence.