## Scatter Plot with Histogram: Confidence vs. Target Length
### Overview
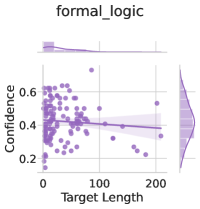
The image displays a scatter plot titled "formal_logic" with a secondary histogram on the right. The scatter plot visualizes the relationship between "Target Length" (x-axis) and "Confidence" (y-axis), while the histogram shows the distribution of Confidence values. A line of best fit is overlaid on the scatter plot, and a legend identifies the data series as "formal_logic" in purple.
---
### Components/Axes
- **Main Chart (Scatter Plot)**:
- **X-axis**: "Target Length" (range: 0 to 200, linear scale).
- **Y-axis**: "Confidence" (range: 0 to 0.8, linear scale).
- **Data Points**: Purple dots representing individual observations.
- **Line of Best Fit**: A dashed purple line with a negative slope, indicating a downward trend.
- **Legend**: Positioned at the top, labeled "formal_logic" in purple.
- **Secondary Chart (Histogram)**:
- **X-axis**: "Confidence" (range: 0.2 to 0.6, linear scale).
- **Y-axis**: "Frequency" (approximate count of observations, no explicit scale).
- **Bars**: Purple, matching the scatter plot's color scheme.
---
### Detailed Analysis
- **Scatter Plot Trends**:
- The line of best fit slopes downward, suggesting a negative correlation between Target Length and Confidence. For example:
- At Target Length ≈ 0, Confidence ≈ 0.6.
- At Target Length ≈ 100, Confidence ≈ 0.4.
- At Target Length ≈ 200, Confidence ≈ 0.2.
- Data points are scattered but cluster around the line, with some variability (e.g., Confidence values between 0.2 and 0.6 for Target Lengths between 50 and 150).
- **Histogram Distribution**:
- The Confidence values are most concentrated around 0.4 (peak frequency).
- The distribution tapers off toward 0.2 and 0.6, indicating fewer observations at the extremes.
---
### Key Observations
1. **Negative Correlation**: As Target Length increases, Confidence decreases, as evidenced by the downward slope of the line of best fit.
2. **Confidence Distribution**: Most observations cluster around Confidence ≈ 0.4, with a bimodal spread toward lower and higher values.
3. **Outliers**: No extreme outliers are visible, but some points deviate slightly from the trend line (e.g., higher Confidence at mid-Target Lengths).
---
### Interpretation
- **What the Data Suggests**: The negative correlation implies that longer Target Lengths are associated with lower confidence levels. This could reflect a trade-off between complexity (Target Length) and certainty (Confidence) in a formal logical or analytical context.
- **Relationships**: The line of best fit quantifies the trend, while the histogram highlights the variability in Confidence. The formal_logic label suggests the data may relate to formal systems, reasoning, or model performance.
- **Anomalies**: The spread of Confidence values at mid-Target Lengths (e.g., 0.3–0.5) indicates inconsistency, possibly due to contextual factors or measurement noise.
- **Significance**: The visualization underscores the importance of balancing Target Length and Confidence in decision-making or model design, particularly in formal logic applications where precision is critical.