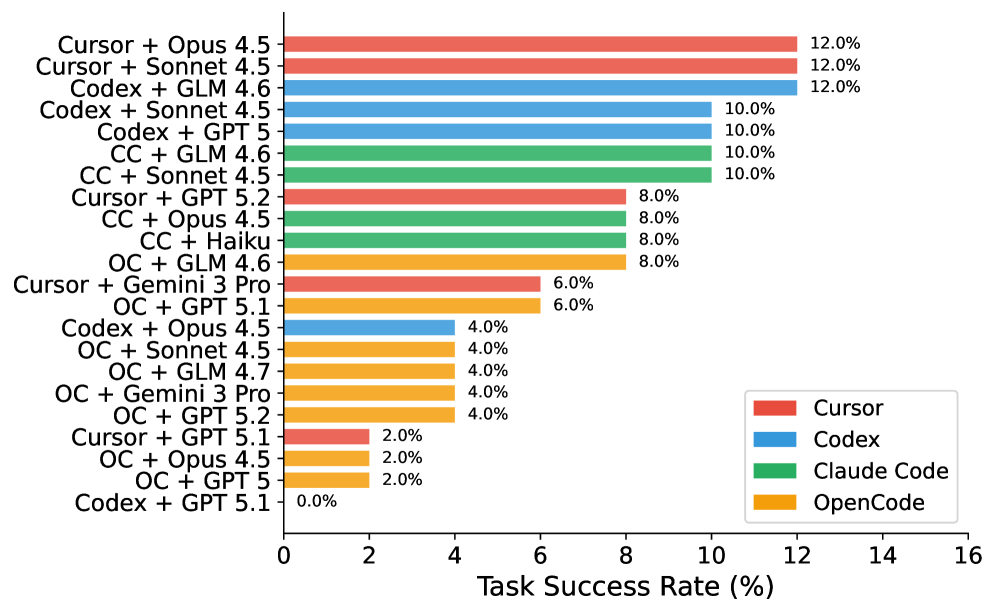
## Horizontal Bar Chart: Task Success Rate Comparison
### Overview
This is a horizontal bar chart comparing the task success rates of different model combinations. The chart displays the success rate as a percentage on the x-axis, and the model combinations are listed on the y-axis. Each model combination is represented by a horizontal bar, color-coded to indicate the primary model used (Cursor, Codex, Claude Code, or OpenCode). The chart aims to visually represent and compare the performance of these different model pairings.
### Components/Axes
* **X-axis Title:** "Task Success Rate (%)" - Scale ranges from 0% to 16%.
* **Y-axis:** Lists the model combinations.
* **Legend:** Located in the top-right corner, identifying the color coding for each primary model:
* Red: Cursor
* Blue: Codex
* Light Green: Claude Code
* Orange: OpenCode
* **Data Series:** Each horizontal bar represents a model combination and its corresponding task success rate.
### Detailed Analysis
The chart presents the following data points. Note that the bars are often composed of multiple colors, representing the contribution of different models to the overall success rate.
1. **Cursor + Opus 4.5:** Approximately 12.0% (Red)
2. **Cursor + Sonnet 4.5:** Approximately 12.0% (Red)
3. **Codex + GLM 4.6:** Approximately 12.0% (Blue)
4. **Codex + Sonnet 4.5:** Approximately 10.0% (Blue)
5. **Codex + GPT 5:** Approximately 10.0% (Blue)
6. **CC + GLM 4.6:** Approximately 10.0% (Light Green)
7. **CC + Sonnet 4.5:** Approximately 10.0% (Light Green)
8. **Cursor + GPT 5.2:** Approximately 8.0% (Red and Orange) - The bar is split, with a red portion and an orange portion.
9. **CC + Opus 4.5:** Approximately 8.0% (Light Green and Red) - The bar is split, with a light green portion and a red portion.
10. **CC + Haiku:** Approximately 8.0% (Light Green)
11. **OC + GLM 4.6:** Approximately 8.0% (Orange)
12. **Cursor + Gemini 3 Pro:** Approximately 6.0% (Red)
13. **OC + GPT 5.1:** Approximately 6.0% (Orange)
14. **Codex + Opus 4.5:** Approximately 4.0% (Blue)
15. **OC + Sonnet 4.5:** Approximately 4.0% (Orange)
16. **OC + GLM 4.7:** Approximately 4.0% (Orange)
17. **OC + Gemini 3 Pro:** Approximately 4.0% (Orange)
18. **OC + GPT 5.2:** Approximately 4.0% (Orange)
19. **Cursor + GPT 5.1:** Approximately 2.0% (Red)
20. **OC + Opus 4.5:** Approximately 2.0% (Orange)
21. **OC + GPT 5:** Approximately 2.0% (Orange)
22. **Codex + GPT 5.1:** Approximately 0.0% (Blue)
The bars are arranged in descending order of task success rate, with the highest rates at the top and the lowest at the bottom.
### Key Observations
* The highest task success rates (around 12%) are achieved by combinations involving Cursor, Codex, and GLM.
* OpenCode combinations generally have lower success rates, with many near 0%.
* Several combinations show a mix of colors, indicating contributions from multiple models. For example, "Cursor + GPT 5.2" has both red (Cursor) and orange (OpenCode) components.
* There is a significant range in task success rates, from 0% to 12%.
### Interpretation
The chart demonstrates a clear performance difference between various model combinations. The Cursor and Codex models, when paired with other models like Opus, Sonnet, and GLM, consistently achieve higher task success rates. OpenCode, while sometimes contributing to success when combined with other models, generally performs poorly on its own.
The mixed-color bars suggest that the success of some combinations relies on the synergistic effect of multiple models. The chart provides valuable insights into the relative strengths and weaknesses of different models and their potential for collaboration. The data suggests that choosing the right model combination is crucial for maximizing task success. The presence of outliers (e.g., Codex + GPT 5.1 at 0%) indicates that certain pairings are particularly ineffective. Further investigation could explore the reasons behind these performance differences and identify optimal model configurations for specific tasks.