## Horizontal Bar Chart: Task Success Rate by Tool-Model Combination
### Overview
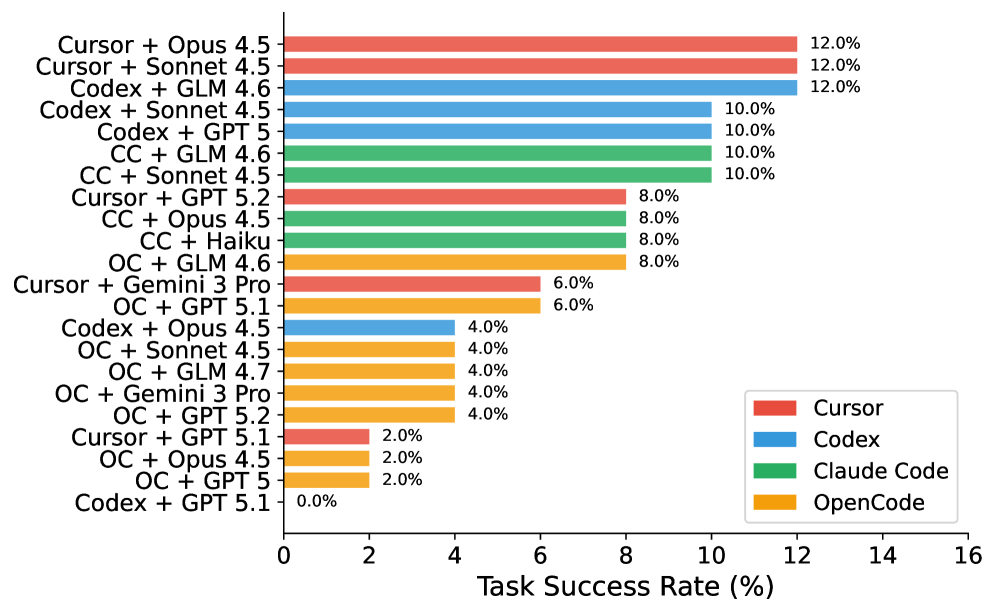
This image is a horizontal bar chart comparing the "Task Success Rate (%)" of various combinations of development tools (Cursor, Codex, Claude Code, OpenCode) paired with different AI models (e.g., Opus 4.5, Sonnet 4.5, GLM 4.6, GPT 5). The chart ranks these combinations from highest to lowest success rate.
### Components/Axes
* **Chart Type:** Horizontal Bar Chart.
* **X-Axis:** Labeled "Task Success Rate (%)". The scale runs from 0 to 16, with major tick marks at intervals of 2 (0, 2, 4, 6, 8, 10, 12, 14, 16).
* **Y-Axis:** Lists 22 distinct tool-model combinations. The labels are left-aligned.
* **Legend:** Located in the bottom-right corner of the chart area. It maps colors to four tool categories:
* **Red:** Cursor
* **Blue:** Codex
* **Green:** Claude Code (abbreviated as "CC" in some y-axis labels)
* **Orange:** OpenCode (abbreviated as "OC" in some y-axis labels)
* **Data Labels:** Each bar has its exact percentage value displayed at its right end.
### Detailed Analysis
The chart presents the following data points, ordered from highest to lowest success rate:
**12.0% Success Rate:**
* Cursor + Opus 4.5 (Red bar)
* Cursor + Sonnet 4.5 (Red bar)
* Codex + GLM 4.6 (Blue bar)
**10.0% Success Rate:**
* Codex + Sonnet 4.5 (Blue bar)
* Codex + GPT 5 (Blue bar)
* CC + GLM 4.6 (Green bar)
* CC + Sonnet 4.5 (Green bar)
**8.0% Success Rate:**
* Cursor + GPT 5.2 (Red bar)
* CC + Opus 4.5 (Green bar)
* CC + Haiku (Green bar)
* OC + GLM 4.6 (Orange bar)
**6.0% Success Rate:**
* Cursor + Gemini 3 Pro (Red bar)
* OC + GPT 5.1 (Orange bar)
**4.0% Success Rate:**
* Codex + Opus 4.5 (Blue bar)
* OC + Sonnet 4.5 (Orange bar)
* OC + GLM 4.7 (Orange bar)
* OC + Gemini 3 Pro (Orange bar)
* OC + GPT 5.2 (Orange bar)
**2.0% Success Rate:**
* Cursor + GPT 5.1 (Red bar)
* OC + Opus 4.5 (Orange bar)
* OC + GPT 5 (Orange bar)
**0.0% Success Rate:**
* Codex + GPT 5.1 (Blue bar)
### Key Observations
1. **Performance Ceiling:** The highest observed task success rate is 12.0%, achieved by three different combinations.
2. **Tool Performance Clusters:**
* **Cursor (Red):** Shows a wide performance range, from 12.0% (top) down to 2.0%.
* **Codex (Blue):** Also has a wide range, from 12.0% down to 0.0% (the lowest value on the chart).
* **Claude Code (Green):** Performance is clustered in the middle-to-high range (8.0% - 10.0%).
* **OpenCode (Orange):** Dominates the lower half of the chart, with most results between 2.0% and 8.0%.
3. **Model Performance:** Certain models like Opus 4.5, Sonnet 4.5, and GLM 4.6 appear frequently in the higher-performing combinations across different tools.
4. **Notable Outlier:** The combination "Codex + GPT 5.1" is the only one with a 0.0% success rate.
### Interpretation
This chart provides a comparative benchmark of how effectively different AI-assisted coding toolchains complete tasks. The data suggests that the choice of both the underlying tool (Cursor, Codex, etc.) and the AI model it's paired with significantly impacts success rates.
* **Tool-Model Synergy:** The top results (12.0%) are not exclusive to one tool, indicating that high performance is achievable through different technological paths (e.g., Cursor with Anthropic models, Codex with GLM).
* **Claude Code's Consistency:** The green bars (Claude Code) show no results below 8.0%, suggesting it may offer more reliable, if not always top-tier, performance across the tested models.
* **OpenCode's Lower Tier:** The prevalence of orange bars (OpenCode) in the lower success brackets could indicate it is either less optimized for these specific tasks or is being tested with a different, potentially more challenging, set of models.
* **The GPT 5.1 Anomaly:** The 0.0% result for "Codex + GPT 5.1" is a critical data point. It could signify a severe incompatibility, a configuration error in the test, or that this specific model version fails completely on the evaluated task suite when used with Codex. This warrants further investigation.
In summary, the chart is a valuable snapshot for developers or researchers to identify promising tool-model combinations and avoid potentially ineffective ones for the class of tasks measured.