## Line Chart: Success Rate vs. Problem Size for Different Models
### Overview
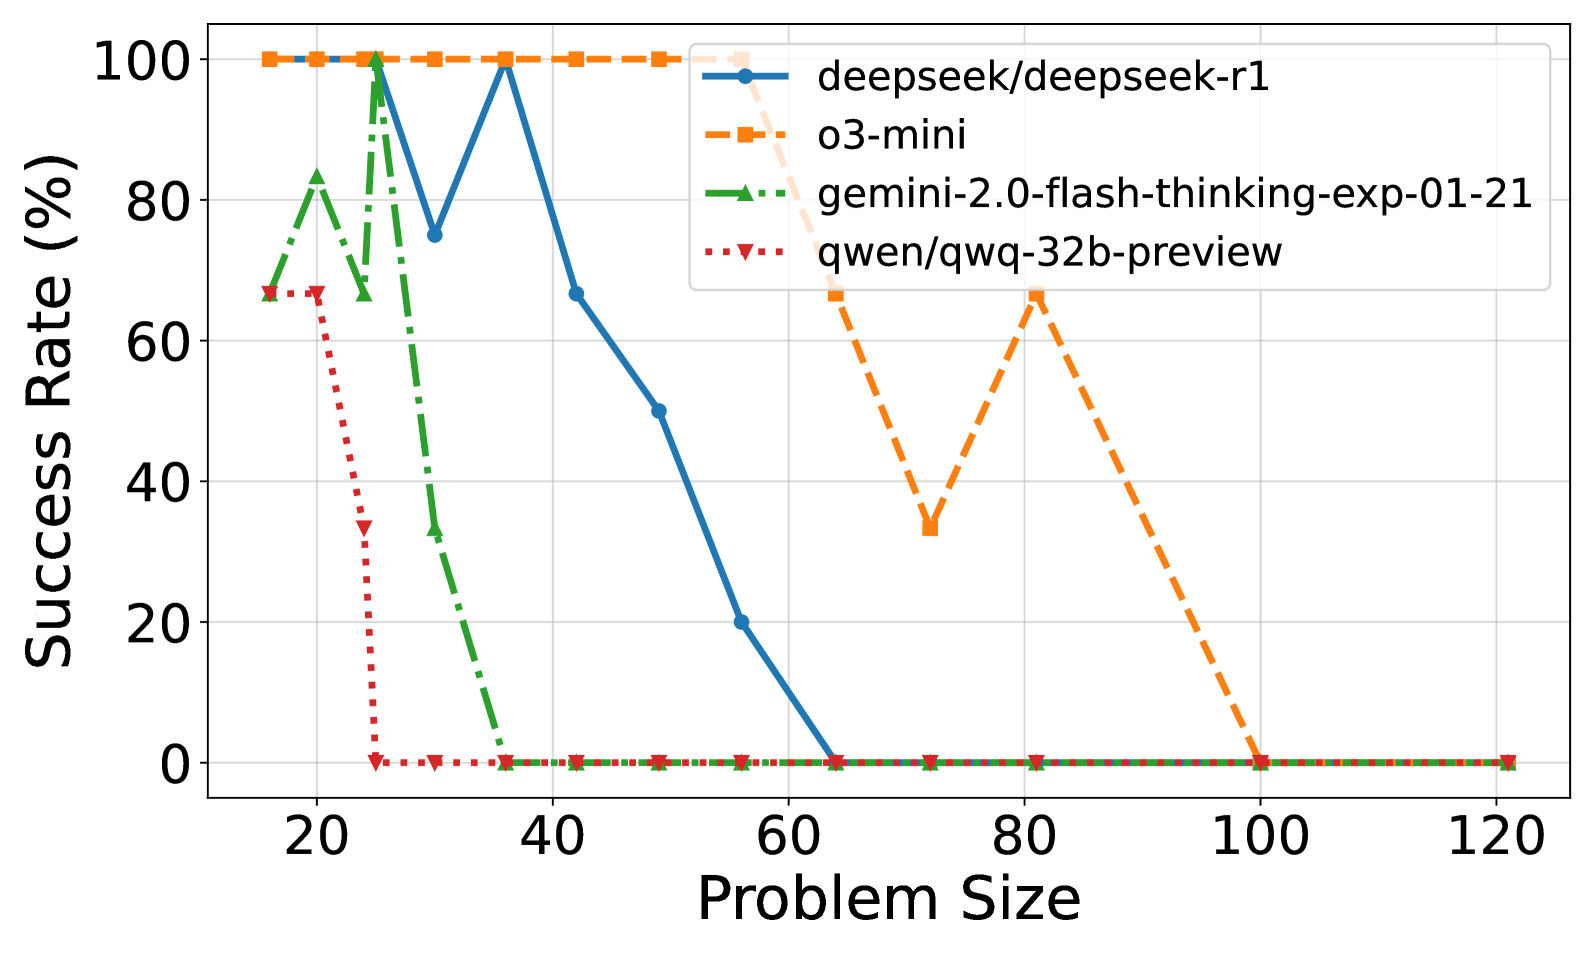
This line chart depicts the success rate of four different models (deepseek/deepseek-r1, o3-mini, gemini-2.0-flash-thinking-exp-01-21, and qwen/qwq-32b-preview) as a function of problem size. The x-axis represents the problem size, and the y-axis represents the success rate in percentage.
### Components/Axes
* **X-axis Title:** "Problem Size" - Scale ranges from approximately 10 to 120.
* **Y-axis Title:** "Success Rate (%)" - Scale ranges from 0 to 100.
* **Legend:** Located in the top-right corner of the chart.
* **deepseek/deepseek-r1:** Solid blue line.
* **o3-mini:** Dashed orange line.
* **gemini-2.0-flash-thinking-exp-01-21:** Dashed green line.
* **qwen/qwq-32b-preview:** Dotted red line.
### Detailed Analysis
* **deepseek/deepseek-r1 (Blue Line):** This line starts at approximately 10% success rate at a problem size of 10, increases to approximately 95% at a problem size of 30, then sharply declines to approximately 0% at a problem size of 60, and remains at 0% for the rest of the range.
* **o3-mini (Orange Dashed Line):** This line begins at approximately 70% success rate at a problem size of 10, remains relatively stable around 95-100% until a problem size of 60, then decreases to approximately 40% at a problem size of 80, and then drops to approximately 0% at a problem size of 100.
* **gemini-2.0-flash-thinking-exp-01-21 (Green Dashed Line):** This line starts at approximately 0% success rate at a problem size of 10, rises to approximately 90% at a problem size of 20, then quickly drops to approximately 0% at a problem size of 40, and remains at 0% for the rest of the range.
* **qwen/qwq-32b-preview (Red Dotted Line):** This line starts at approximately 65% success rate at a problem size of 10, increases to approximately 98% at a problem size of 20, then decreases to approximately 35% at a problem size of 80, and then rises to approximately 65% at a problem size of 80, and then drops to approximately 0% at a problem size of 100.
### Key Observations
* The `deepseek/deepseek-r1` model exhibits a very sharp decline in success rate after a problem size of 30.
* The `o3-mini` model maintains a high success rate for smaller problem sizes (up to 60) but degrades rapidly beyond that.
* The `gemini-2.0-flash-thinking-exp-01-21` model shows a quick rise and fall in success rate, peaking around a problem size of 20.
* The `qwen/qwq-32b-preview` model has the most volatile performance, with significant fluctuations in success rate across different problem sizes.
### Interpretation
The chart demonstrates the scalability of different models in solving problems of varying sizes. The success rate is a metric of how well each model performs on the given task as the complexity (represented by problem size) increases.
* **deepseek/deepseek-r1** appears to be effective only for very small problem sizes. Its rapid decline suggests it struggles with increased complexity.
* **o3-mini** is robust for problems up to size 60, but becomes ineffective beyond that point. This indicates a limitation in its capacity to handle larger problems.
* **gemini-2.0-flash-thinking-exp-01-21** shows a quick initial success, but quickly becomes unreliable as the problem size increases. This could be due to overfitting or a lack of generalization ability.
* **qwen/qwq-32b-preview** exhibits the most complex behavior. Its fluctuating success rate suggests it may be sensitive to specific problem characteristics or have a more nuanced relationship with problem size. The initial high success rate, followed by a dip and then a rise, could indicate a learning curve or adaptation process.
The differences in performance highlight the importance of selecting a model appropriate for the expected problem size. The chart suggests that no single model consistently outperforms the others across all problem sizes. The optimal choice depends on the specific application and the range of problem sizes encountered.