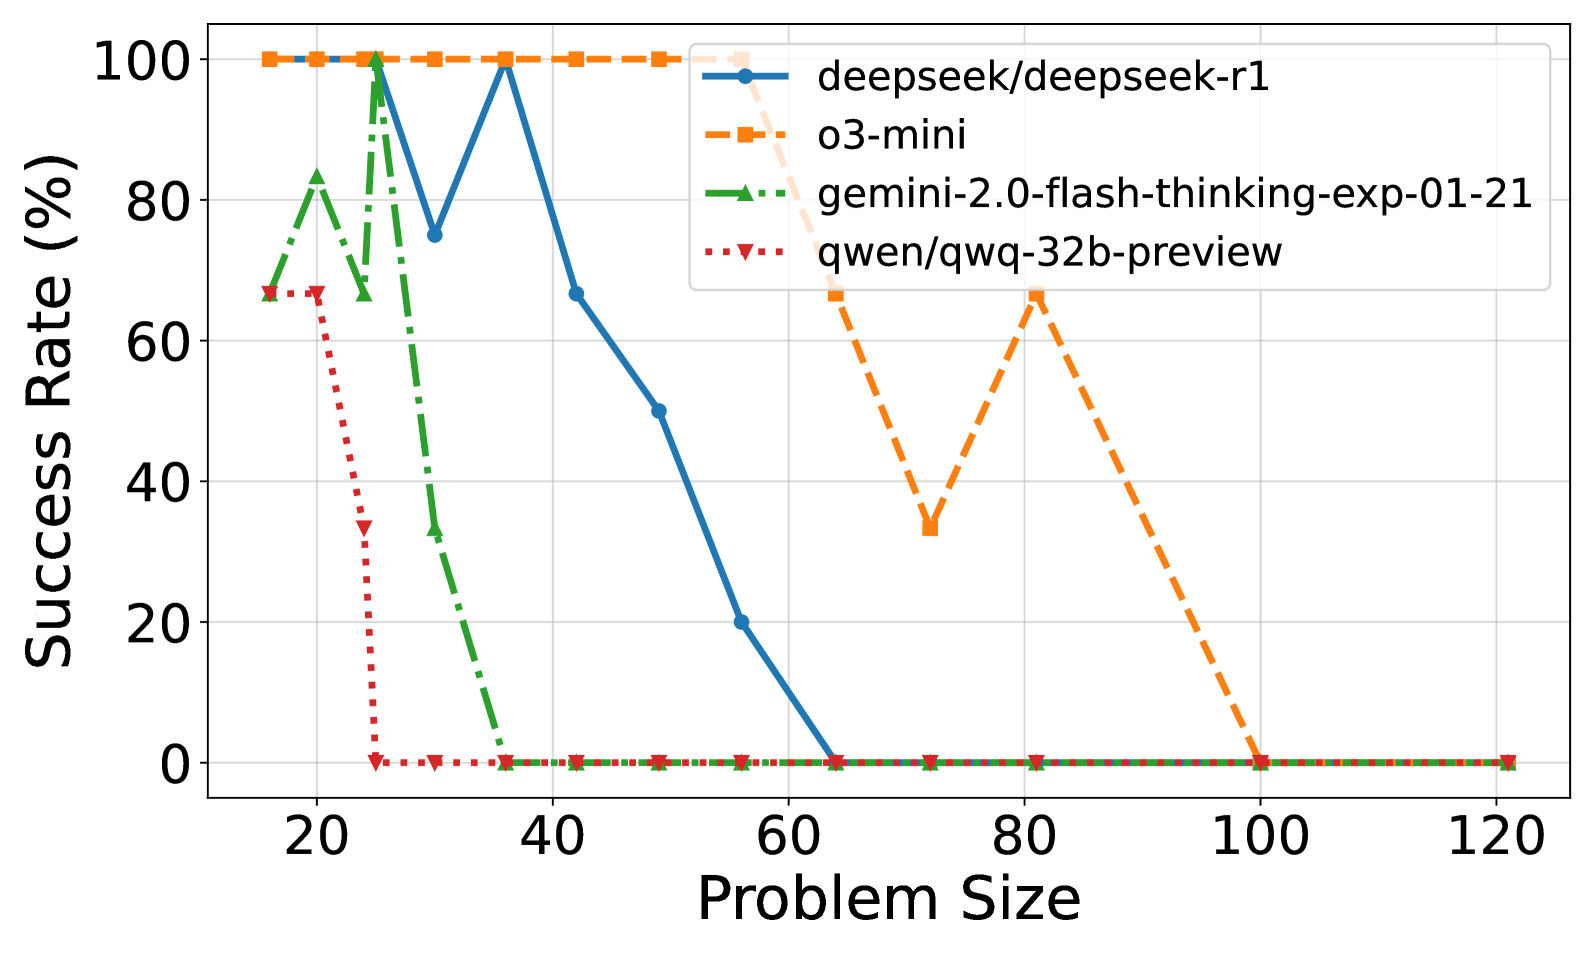
## Line Graph: Model Success Rates Across Problem Sizes
### Overview
The graph compares the success rates of four AI models (deepseek/deepseek-r1, o3-mini, gemini-2.0-flash-thinking-exp-01-21, qwen/qwq-32b-preview) as problem size increases from 20 to 120. Success rate is measured in percentage, with all models starting near 100% at smaller problem sizes but declining at varying rates.
### Components/Axes
- **X-axis (Problem Size)**: Ranges from 20 to 120 in increments of 20.
- **Y-axis (Success Rate %)**: Ranges from 0 to 100 in increments of 20.
- **Legend**: Located in the top-right corner, mapping colors to models:
- Blue solid line: deepseek/deepseek-r1
- Orange dashed line: o3-mini
- Green dash-dot line: gemini-2.0-flash-thinking-exp-01-21
- Red dotted line: qwen/qwq-32b-preview
### Detailed Analysis
1. **deepseek/deepseek-r1 (Blue)**:
- Starts at 100% success rate at problem size 20.
- Sharp decline to ~75% at 30, ~65% at 40, ~50% at 50, ~20% at 60, then stabilizes near 0% for sizes ≥70.
- Trend: Rapid early degradation followed by plateau.
2. **o3-mini (Orange)**:
- Maintains 100% success rate until problem size 60.
- Drops to ~30% at 70, ~65% at 80, then stabilizes near 0% for sizes ≥90.
- Trend: Sudden collapse after problem size 60.
3. **gemini-2.0-flash-thinking-exp-01-21 (Green)**:
- Begins at ~65% at 20, peaks at ~80% at 25, then plummets to 0% by 40.
- Remains at 0% for all larger problem sizes.
- Trend: Brief improvement followed by catastrophic failure.
4. **qwen/qwq-32b-preview (Red)**:
- Starts at ~65% at 20, drops to ~35% at 25, then collapses to 0% by 40.
- Remains at 0% for all larger problem sizes.
- Trend: Steep early decline with no recovery.
### Key Observations
- **o3-mini** demonstrates the most robust performance across larger problem sizes (up to 60), though it fails catastrophically beyond that.
- **deepseek/deepseek-r1** shows gradual degradation but retains some capability at problem size 60 (~20% success).
- **gemini** and **qwen** exhibit early failure patterns, collapsing to 0% success by problem size 40.
- All models fail completely (0% success) for problem sizes ≥90, except o3-mini at 80 (~65%).
### Interpretation
The data suggests that model performance degrades non-linearly with problem size, with most models failing entirely beyond a critical threshold. o3-mini and deepseek-r1 exhibit superior scalability, maintaining partial functionality at larger problem sizes. The abrupt drops (e.g., gemini at 40, qwen at 40) indicate potential architectural limitations in handling complexity beyond specific problem sizes. The divergence in failure patterns implies differing optimization strategies: o3-mini prioritizes consistency until a critical point, while others prioritize early performance at the cost of scalability.