## Grouped Bar Chart: Generative Accuracy by Number of Generalizations
### Overview
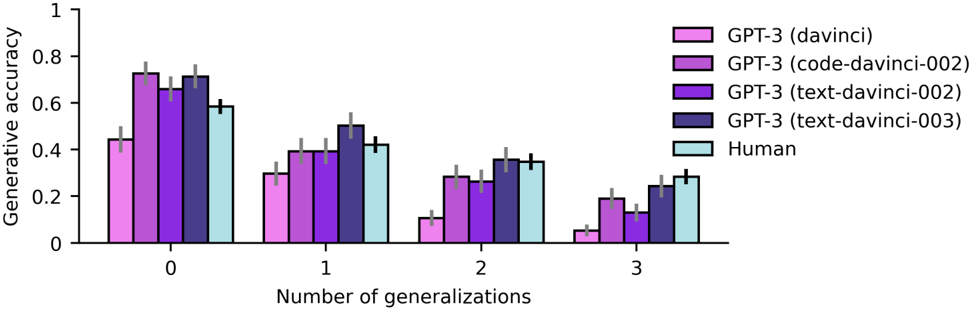
This is a grouped bar chart comparing the "Generative accuracy" of four different GPT-3 model variants and a "Human" baseline. The performance is measured across four distinct categories based on the "Number of generalizations" required (0, 1, 2, and 3). The chart includes error bars for each data point, indicating variability or confidence intervals.
### Components/Axes
* **Chart Type:** Grouped Bar Chart.
* **X-Axis (Horizontal):** Labeled "Number of generalizations". It has four categorical groups: `0`, `1`, `2`, and `3`.
* **Y-Axis (Vertical):** Labeled "Generative accuracy". It is a linear scale ranging from `0` to `1`, with major tick marks at intervals of `0.2` (0, 0.2, 0.4, 0.6, 0.8, 1).
* **Legend:** Located in the top-right corner of the chart area. It defines five data series with corresponding colors:
* **GPT-3 (davinci):** Light pink/magenta.
* **GPT-3 (code-davinci-002):** Medium purple.
* **GPT-3 (text-davinci-002):** Dark purple.
* **GPT-3 (text-davinci-003):** Dark blue/indigo.
* **Human:** Light cyan/blue.
* **Error Bars:** Each bar has a vertical black line extending from its top, representing the margin of error or standard deviation.
### Detailed Analysis
The following table reconstructs the approximate generative accuracy values for each entity across the four generalization categories. Values are estimated from the bar heights relative to the y-axis. The approximate range of the error bars is noted in parentheses.
| Number of Generalizations | GPT-3 (davinci) | GPT-3 (code-davinci-002) | GPT-3 (text-davinci-002) | GPT-3 (text-davinci-003) | Human |
| :--- | :--- | :--- | :--- | :--- | :--- |
| **0** | ~0.44 (±0.05) | ~0.73 (±0.04) | ~0.68 (±0.05) | ~0.72 (±0.04) | ~0.59 (±0.03) |
| **1** | ~0.30 (±0.04) | ~0.40 (±0.04) | ~0.39 (±0.04) | ~0.51 (±0.05) | ~0.42 (±0.03) |
| **2** | ~0.11 (±0.03) | ~0.29 (±0.04) | ~0.27 (±0.04) | ~0.36 (±0.04) | ~0.35 (±0.03) |
| **3** | ~0.05 (±0.02) | ~0.19 (±0.03) | ~0.14 (±0.03) | ~0.24 (±0.03) | ~0.29 (±0.03) |
**Trend Verification per Data Series:**
* **GPT-3 (davinci):** Shows a steep, consistent downward trend. Accuracy is highest at 0 generalizations (~0.44) and drops sharply to near zero at 3 generalizations (~0.05).
* **GPT-3 (code-davinci-002):** Also shows a clear downward trend, starting as the top performer at 0 generalizations (~0.73) and declining to ~0.19 at 3.
* **GPT-3 (text-davinci-002):** Follows a similar downward trajectory to `code-davinci-002`, starting at ~0.68 and ending at ~0.14.
* **GPT-3 (text-davinci-003):** Exhibits a downward trend but maintains the highest accuracy among the AI models at 1, 2, and 3 generalizations. It starts at ~0.72 and ends at ~0.24.
* **Human:** Shows a steady downward trend, starting at ~0.59 and ending at ~0.29. Notably, the human performance curve is less steep than most AI models.
### Key Observations
1. **Universal Performance Decline:** All five entities show a monotonic decrease in generative accuracy as the number of generalizations increases from 0 to 3.
2. **Model Hierarchy Shift:** At 0 generalizations, `code-davinci-002` and `text-davinci-003` are the top performers, significantly outperforming humans. However, as generalizations increase, the performance gap narrows and inverts.
3. **Human Resilience:** While human accuracy also declines, it degrades more gracefully than the AI models. At 3 generalizations, the human baseline (~0.29) surpasses all listed GPT-3 variants, with the closest model (`text-davinci-003`) at ~0.24.
4. **Model Comparison:** `text-davinci-003` consistently outperforms `text-davinci-002` and `davinci` across all categories. `code-davinci-002` is the strongest at 0 generalizations but falls behind `text-davinci-003` for higher generalization counts.
5. **Error Bars:** The error bars are relatively consistent across models and categories, suggesting similar levels of variance in the measurements. They do not overlap between the top and bottom performers within a category, indicating the differences are likely statistically significant.
### Interpretation
This chart demonstrates a clear inverse relationship between task complexity (operationalized as the "number of generalizations") and generative accuracy for both advanced AI models and humans. The data suggests that while certain GPT-3 models (particularly `code-davinci-002` and `text-davinci-003`) can achieve superhuman performance on tasks requiring zero generalization, their advantage diminishes rapidly as the need for abstraction or transfer of knowledge increases.
The key insight is the **crossover point in performance**. Humans appear to have a more robust or different mechanism for handling multiple generalizations, allowing them to maintain a higher baseline accuracy under more complex conditions. This implies that the AI models' generative capabilities, while powerful, may be more brittle and specialized to the specific patterns seen in their training data, struggling to generalize as effectively as humans when faced with novel combinations or abstractions. The chart highlights a specific frontier in AI capability: robust, multi-step generalization.