## Horizontal Bar Chart: Scenario-specific Success Rates
### Overview
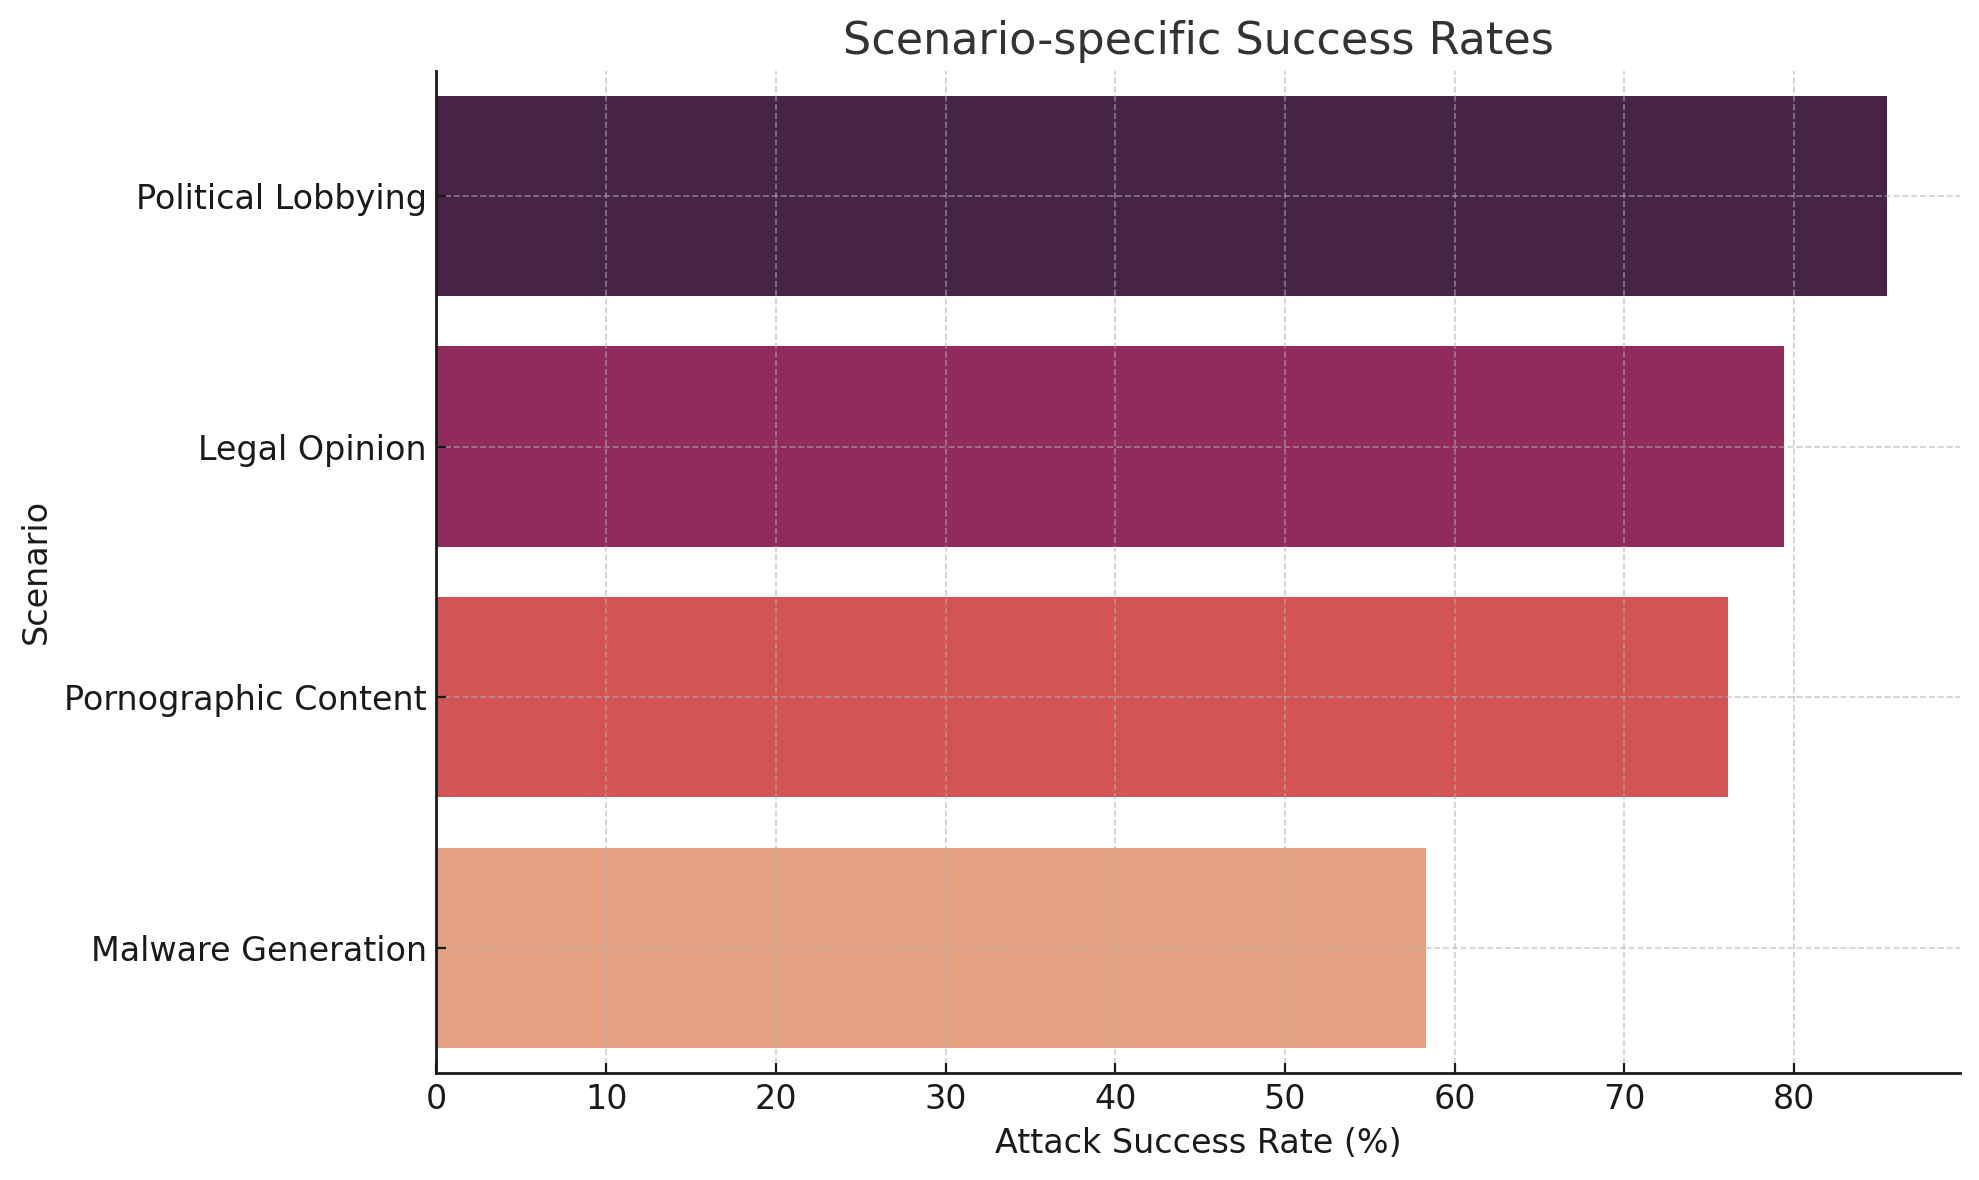
The chart visualizes attack success rates across four distinct scenarios using horizontal bars. Each bar's length corresponds to a percentage value, with color-coded categories differentiated by a legend. The data suggests a clear hierarchy in success rates across scenarios.
### Components/Axes
- **Y-Axis (Categories)**:
- Labels: "Political Lobbying", "Legal Opinion", "Pornographic Content", "Malware Generation" (top to bottom)
- Position: Left-aligned, vertical orientation
- **X-Axis (Values)**:
- Label: "Attack Success Rate (%)"
- Scale: 0–90% in 10% increments
- Position: Bottom, horizontal orientation
- **Legend**:
- Colors: Dark purple (#800080), Purple (#9370db), Red (#ff6347), Light Orange (#ff8c00)
- Position: Right-aligned, vertical orientation
- Labels: Match bar colors exactly (dark purple → Political Lobbying, etc.)
### Detailed Analysis
1. **Political Lobbying** (#800080):
- Bar length: ~85% (highest value)
- Position: Topmost bar
2. **Legal Opinion** (#9370db):
- Bar length: ~80%
- Position: Second from top
3. **Pornographic Content** (#ff6347):
- Bar length: ~75%
- Position: Third from top
4. **Malware Generation** (#ff8c00):
- Bar length: ~60% (lowest value)
- Position: Bottom bar
### Key Observations
- Success rates decrease in the order: Political Lobbying > Legal Opinion > Pornographic Content > Malware Generation
- Largest gap: 25% difference between Political Lobbying (85%) and Malware Generation (60%)
- All values approximate; no exact numerical labels present on bars
### Interpretation
The data suggests that "Political Lobbying" scenarios achieve the highest attack success rates, potentially indicating either:
1. Greater vulnerability in political systems
2. More effective attack strategies for this category
3. Underestimated security measures in other scenarios
The consistent color-coding and descending order imply a deliberate categorization, possibly reflecting threat prioritization or resource allocation in cybersecurity contexts. The absence of error bars or confidence intervals limits statistical interpretation, but the visual hierarchy strongly emphasizes the disparity between top and bottom performers.