## Line Graph: Model Accuracy vs. Compute (exaFLOP)
### Overview
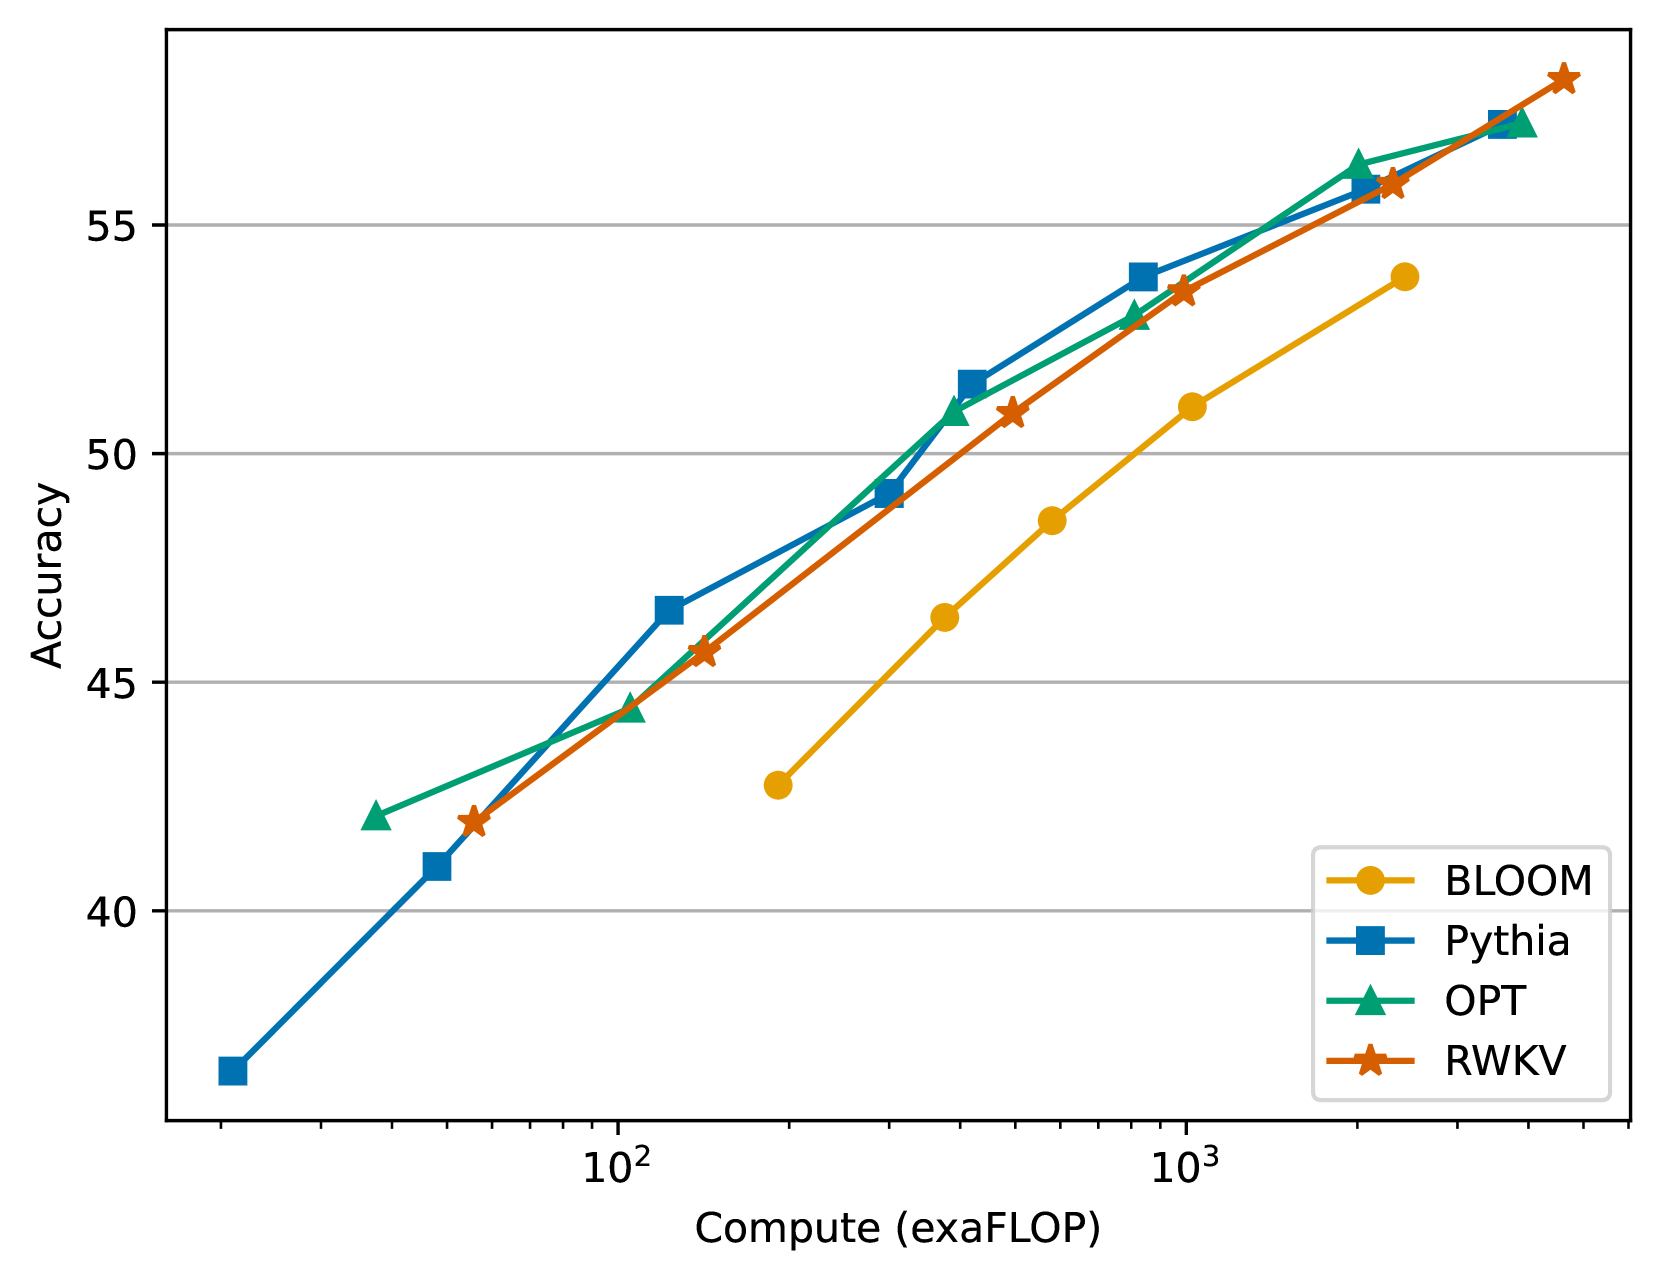
The image is a line graph comparing the accuracy of four language models (BLOOM, Pythia, OPT, RWKV) across varying computational resources (exaFLOP). The x-axis represents compute power on a logarithmic scale (10² to 10³ exaFLOP), while the y-axis shows accuracy (40–55). Four distinct data series are plotted with unique symbols and colors.
### Components/Axes
- **X-axis (Compute)**: Labeled "Compute (exaFLOP)" with a logarithmic scale (10², 10³).
- **Y-axis (Accuracy)**: Labeled "Accuracy" with a linear scale (40–55).
- **Legend**: Located in the bottom-right corner, mapping:
- **Orange circles**: BLOOM
- **Blue squares**: Pythia
- **Green triangles**: OPT
- **Red stars**: RWKV
### Detailed Analysis
1. **BLOOM (Orange Circles)**:
- Starts at ~42.5 accuracy at 10² exaFLOP.
- Increases steadily to ~51 accuracy at 10³ exaFLOP.
- Slope: Gentle upward trend.
2. **Pythia (Blue Squares)**:
- Begins at ~41 accuracy at 10² exaFLOP.
- Rises sharply to ~54 accuracy at 10³ exaFLOP.
- Slope: Steeper than BLOOM.
3. **OPT (Green Triangles)**:
- Starts at ~42 accuracy at 10² exaFLOP.
- Increases steadily to ~56 accuracy at 10³ exaFLOP.
- Slope: Moderate upward trend.
4. **RWKV (Red Stars)**:
- Begins at ~41 accuracy at 10² exaFLOP.
- Rises sharply to ~58 accuracy at 10³ exaFLOP.
- Slope: Steepest among all models.
### Key Observations
- **All models improve accuracy with increased compute**, but rates vary.
- **RWKV** achieves the highest accuracy (~58) at 10³ exaFLOP, surpassing others.
- **BLOOM** has the lowest final accuracy (~51) despite similar starting points.
- **Pythia** and **RWKV** show the steepest performance gains.
- At 10² exaFLOP, all models cluster between 41–42.5 accuracy.
### Interpretation
The graph demonstrates a clear relationship between computational resources and model accuracy. RWKV exhibits the most efficient scaling, achieving the highest accuracy with minimal compute. Pythia and OPT follow closely, while BLOOM lags despite comparable initial performance. The logarithmic x-axis emphasizes exponential scaling benefits, suggesting that even small increases in compute (e.g., 10² to 10³ exaFLOP) yield significant accuracy improvements. This highlights the importance of resource allocation for model training and deployment.