## Medical Diagram: Diabetes Progression
### Overview
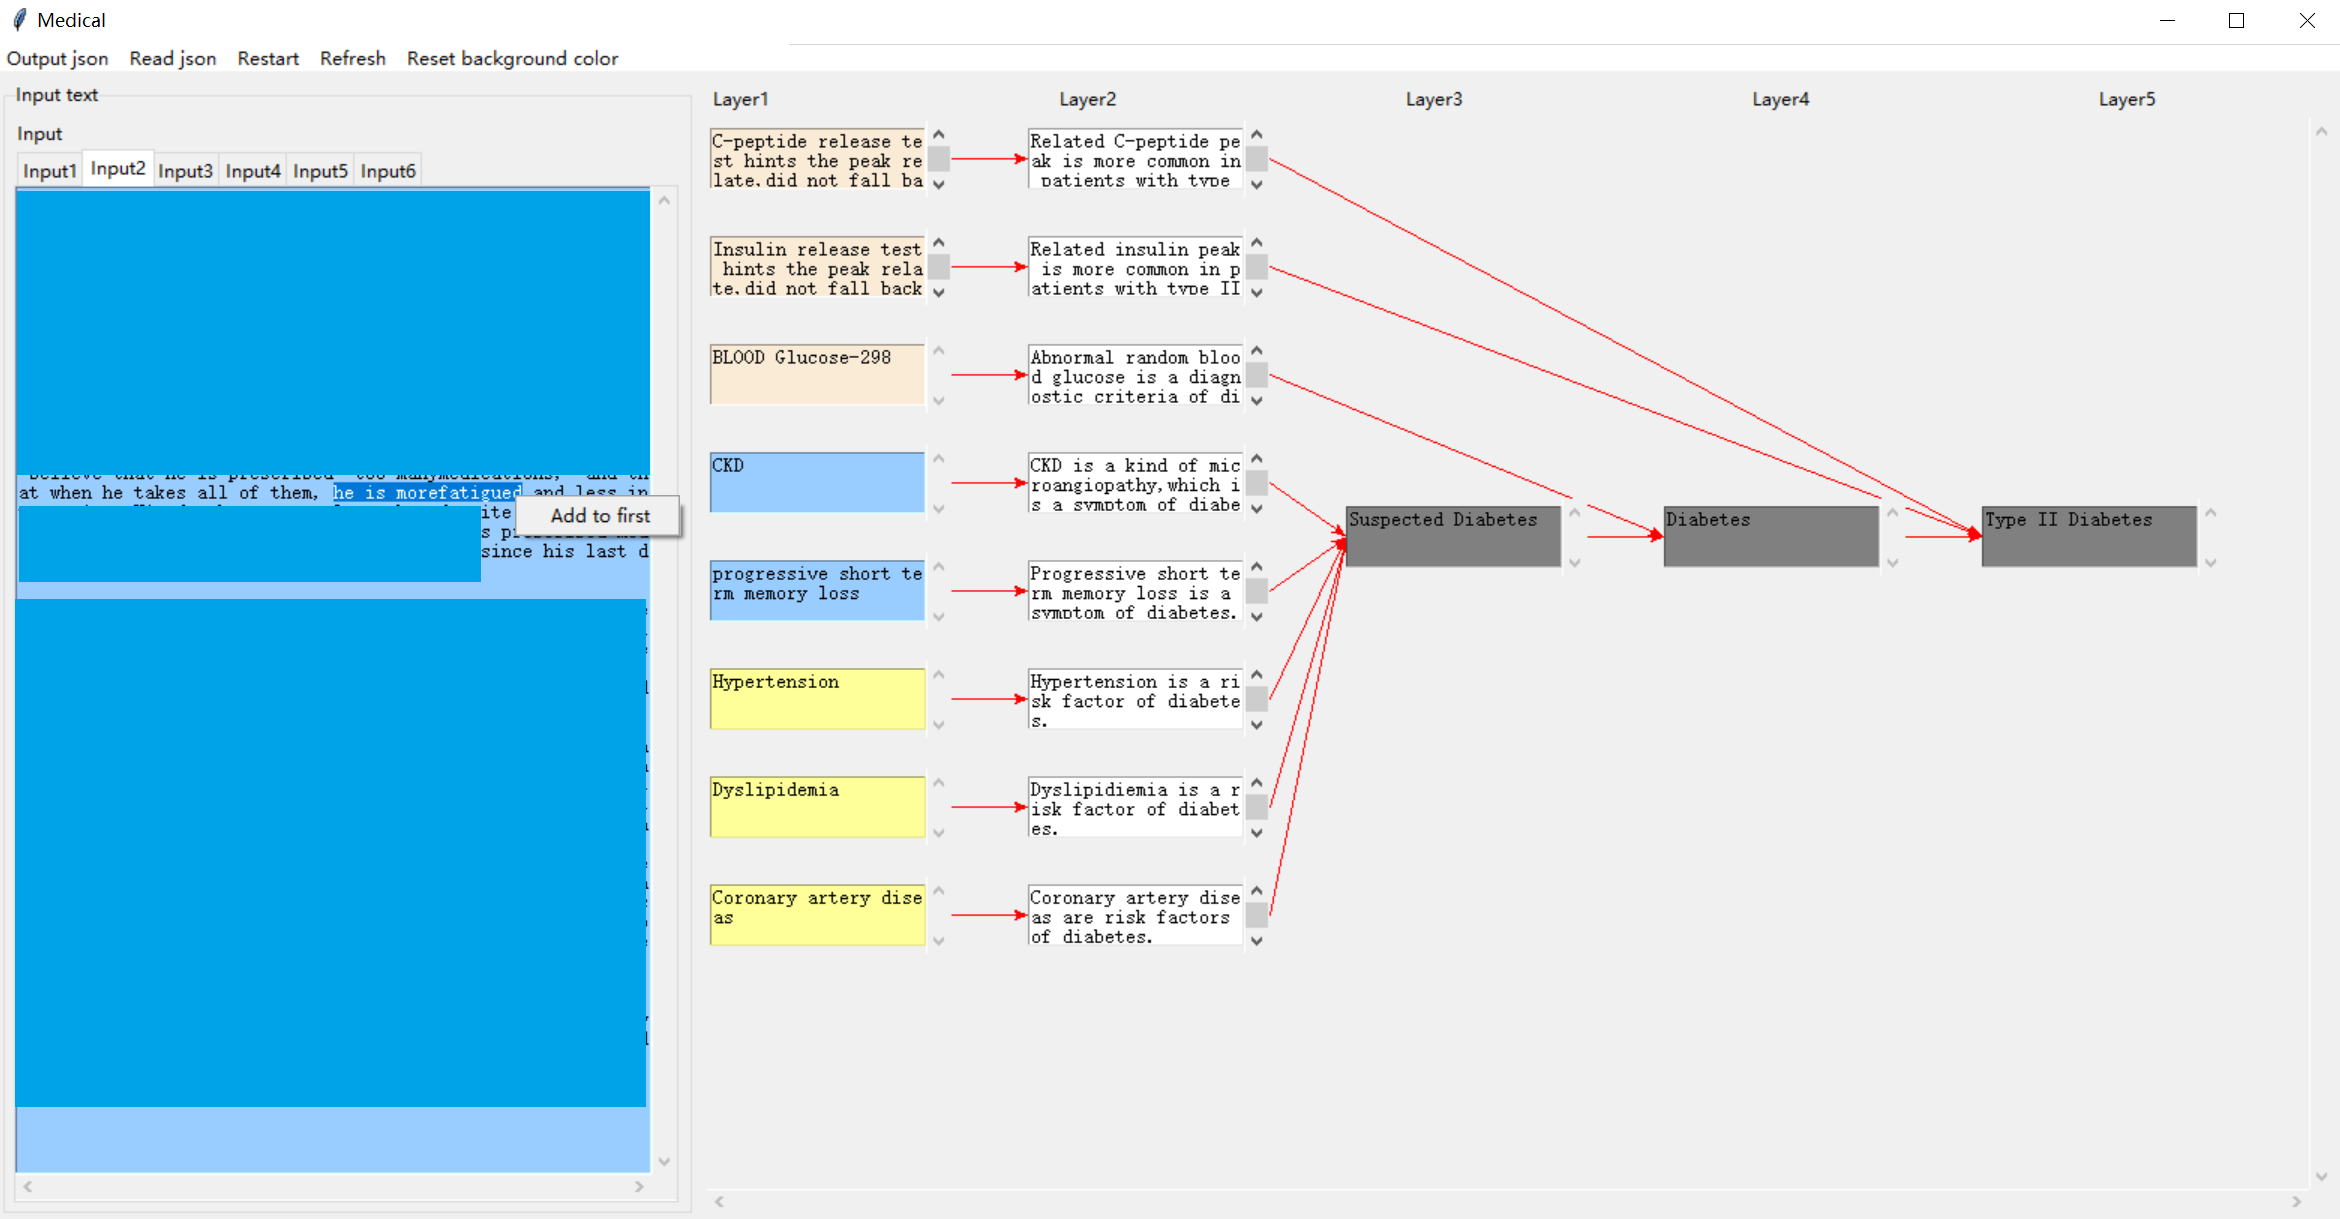
The image is a medical diagram illustrating the potential progression of diabetes, starting from initial indicators and risk factors (Layer 1) and moving through intermediate stages (Layers 2, 3, and 4) to Type II Diabetes (Layer 5). The diagram uses a layered structure with arrows indicating the flow of information or progression of the condition.
### Components/Axes
* **Title:** Medical (top-left)
* **Input Area:** Top-left corner, labeled "Input text" and "Input" with buttons "Input1" through "Input6".
* **Layers:** The diagram is divided into five layers, labeled "Layer1" through "Layer5" horizontally across the top.
* **Nodes:** Each layer contains several nodes representing medical conditions or test results.
* **Arrows:** Red arrows connect nodes across layers, indicating relationships or progression.
### Detailed Analysis or ### Content Details
**Layer 1:**
* **C-peptide release test:** "C-peptide release test hints the peak relate. did not fall back" (Top node, color not specified, assumed to be blue).
* **Insulin release test:** "Insulin release test hints the peak relate. did not fall back" (Second node, color not specified, assumed to be blue).
* **BLOOD Glucose-298:** "BLOOD Glucose-298" (Third node, color not specified, assumed to be blue).
* **CKD:** "CKD" (Fourth node, color not specified, assumed to be blue).
* **Progressive short term memory loss:** "progressive short term memory loss" (Fifth node, color not specified, assumed to be blue).
* **Hypertension:** "Hypertension" (Sixth node, yellow).
* **Dyslipidemia:** "Dyslipidemia" (Seventh node, color not specified, assumed to be yellow).
* **Coronary artery disease:** "Coronary artery disease as" (Eighth node, color not specified, assumed to be yellow).
**Layer 2:**
* **Related C-peptide peak:** "Related C-peptide peak is more common in patients with type" (Top node, color not specified, assumed to be blue).
* **Related insulin peak:** "Related insulin peak is more common in patients with type II" (Second node, color not specified, assumed to be blue).
* **Abnormal random blood glucose:** "Abnormal random blood glucose is a diagnostic criteria of di" (Third node, color not specified, assumed to be blue).
* **CKD (description):** "CKD is a kind of microangiopathy, which is a symptom of diabe" (Fourth node, color not specified, assumed to be blue).
* **Progressive short term memory loss (description):** "Progressive short term memory loss is a symptom of diabetes." (Fifth node, color not specified, assumed to be blue).
* **Hypertension (description):** "Hypertension is a risk factor of diabetes." (Sixth node, color not specified, assumed to be yellow).
* **Dyslipidemia (description):** "Dyslipidemia is a risk factor of diabetes." (Seventh node, color not specified, assumed to be yellow).
* **Coronary artery disease (description):** "Coronary artery disease as are risk factors of diabetes." (Eighth node, color not specified, assumed to be yellow).
**Layer 3:**
* **Suspected Diabetes:** "Suspected Diabetes" (Single node, gray).
**Layer 4:**
* **Diabetes:** "Diabetes" (Single node, gray).
**Layer 5:**
* **Type II Diabetes:** "Type II Diabetes" (Single node, gray).
**Connections (Arrows):**
* Multiple red arrows originate from Layer 1 nodes (CKD, Progressive short term memory loss, Hypertension, Dyslipidemia, Coronary artery disease) and converge on the "Suspected Diabetes" node in Layer 3.
* A red arrow connects "Suspected Diabetes" in Layer 3 to "Diabetes" in Layer 4.
* A red arrow connects "Diabetes" in Layer 4 to "Type II Diabetes" in Layer 5.
**Text Area (Left Side):**
* "believe that he is prescribed too many medications, and less in"
* "at when he takes all of them, he is morefatigued and less in"
* "ite Add to first"
* "s pi"
* "since his last d"
### Key Observations
* The diagram illustrates a progression from risk factors and initial test results to suspected diabetes, diabetes, and finally Type II diabetes.
* Several risk factors (Hypertension, Dyslipidemia, Coronary artery disease) directly lead to "Suspected Diabetes."
* The "Input" area suggests the possibility of entering patient data to influence the diagram's output.
### Interpretation
The diagram represents a simplified model of diabetes progression. It suggests that certain risk factors and initial diagnostic findings can lead to a suspicion of diabetes, which can then progress to a diagnosis of diabetes and ultimately to Type II diabetes. The red arrows indicate a causal or correlational relationship between the nodes. The input area suggests a tool designed to assess diabetes risk based on patient data. The text area on the left seems to be a note or comment, possibly related to patient management or medication.