# Technical Document Extraction: Medical Software Interface
## Overview
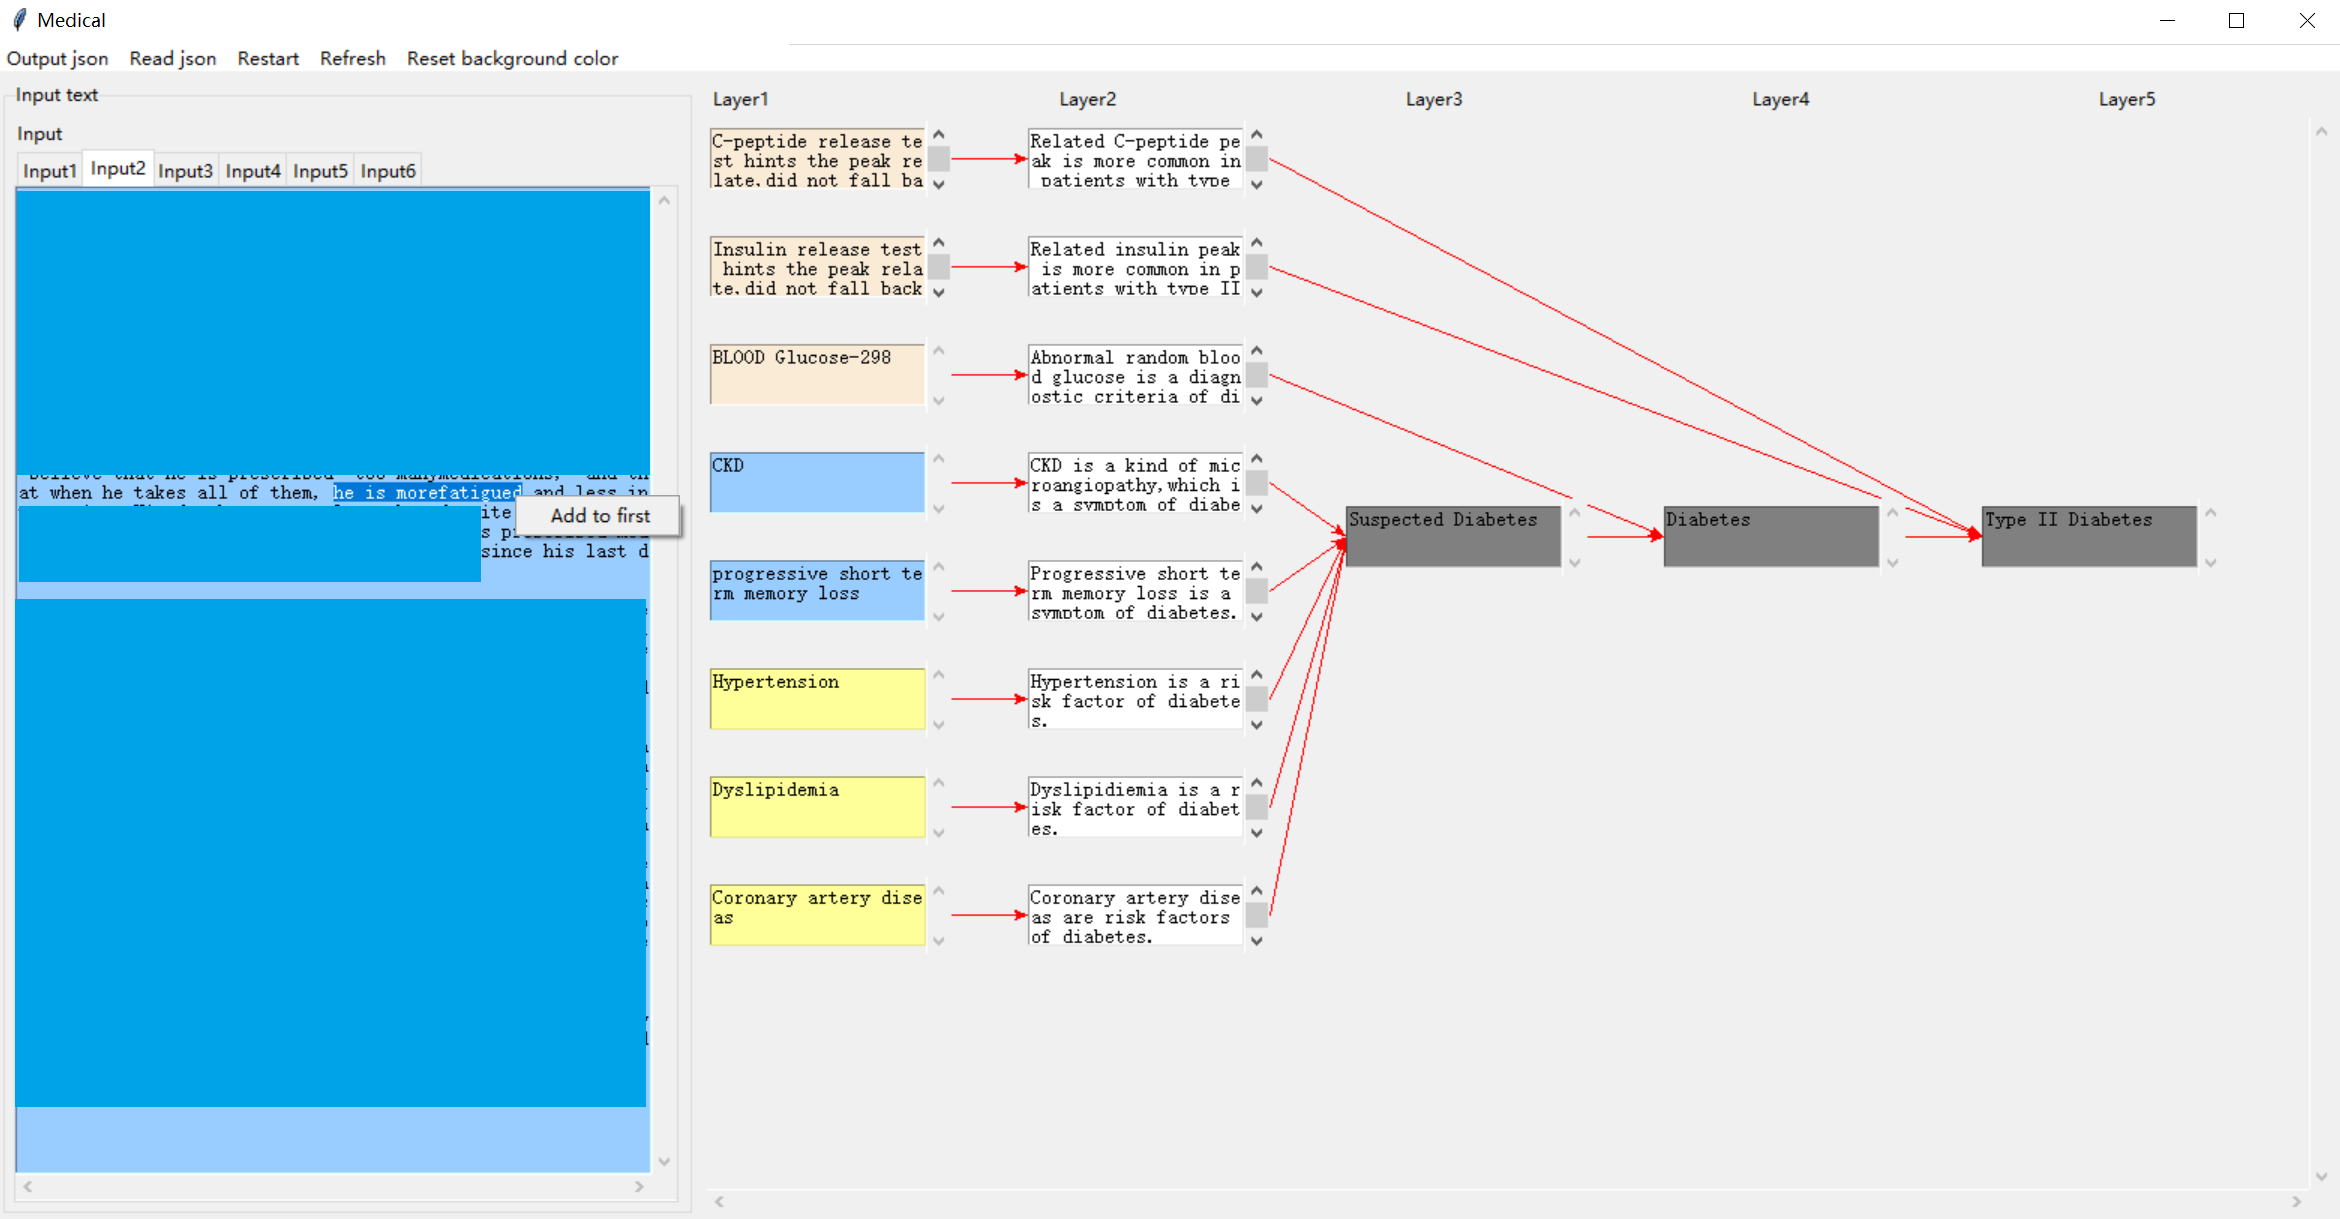
The image depicts a medical diagnostic workflow visualization tool with a flowchart and input/output panels. The interface appears to analyze clinical data to determine diabetes risk.
---
## Left Panel: Input/Output Section
### Structure
- **Header**: "Medical" (top-left corner)
- **Control Panel**:
- Options: `Output json`, `Read json`, `Restart`, `Refresh`, `Reset background color`
- **Input Fields**:
- `Input1` to `Input6` (horizontal row)
- `Input2` highlighted (white background)
- **Text Blocks**:
- Two large blue blocks (content obscured)
- Partial visible text in `Input1`/`Input2`:
```
"believe that he is prescribed too many medications... he is more fatigued... he is more fatigued and less in..."
```
- **Action Button**: "Add to first" (bottom-left)
---
## Right Panel: Diagnostic Flowchart
### Structure
- **Layers**: 5 horizontal layers (Layer1 to Layer5)
- **Color Coding**:
- **Peach**: Layer1
- **Blue**: Layer2
- **Gray**: Layer3/Layer4/Layer5
- **Connections**: Red arrows indicate data flow between layers
### Layer Details
#### Layer1 (Peach)
1. **Box 1**:
- Text: `"C-peptide release test... did not fall ba..."`
- Connection: Right arrow to Layer2 Box 1
2. **Box 2**:
- Text: `"Insulin release test... did not fall back..."`
- Connection: Right arrow to Layer2 Box 2
3. **Box 3**:
- Text: `"BLOOD Glucose-298"`
- Connection: Right arrow to Layer2 Box 3
#### Layer2 (Blue)
1. **Box 1**:
- Text: `"Related C-peptide peak... patients with type..."`
- Connection: Right arrow to Layer3 Box 1
2. **Box 2**:
- Text: `"Related insulin peak... is more common in p... patients with type II..."`
- Connection: Right arrow to Layer3 Box 2
3. **Box 3**:
- Text: `"Abnormal random blood glucose... is a diagnostic criteria of di..."`
- Connection: Right arrow to Layer3 Box 3
4. **Box 4**:
- Text: `"CKD is a kind of microangiopathy... symptom of diabetes."`
- Connection: Right arrow to Layer3 Box 4
#### Layer3 (Gray)
1. **Box 1**:
- Text: `"Progressive short-term memory loss... symptom of diabetes."`
- Connection: Right arrow to Layer4 Box 1
2. **Box 2**:
- Text: `"Suspected Diabetes"` (central node)
- Connections:
- Left: From Layer2 Box 4
- Right: To Layer4 Box 2
- Down: To Layer5 Box 1
#### Layer4 (Gray)
1. **Box 1**:
- Text: `"Hypertension is a risk factor of diabetes."`
- Connection: Right arrow to Layer5 Box 2
2. **Box 2**:
- Text: `"Diabetes"` (intermediate node)
- Connections:
- Left: From Layer3 Box 2
- Right: To Layer5 Box 3
#### Layer5 (Gray)
1. **Box 1**:
- Text: `"Type II Diabetes"` (final diagnosis)
- Connections:
- Left: From Layer3 Box 2
- Left: From Layer4 Box 2
- Right: From Layer4 Box 3
---
## Key Observations
1. **Diagnostic Flow**:
- Clinical tests (Layer1) → Abnormal results (Layer2) → Complications (Layer3) → Diagnosis (Layer4) → Final Diagnosis (Layer5)
2. **Critical Path**:
- `CKD` (Layer2) → `Suspected Diabetes` (Layer3) → `Type II Diabetes` (Layer5)
3. **Risk Factors**:
- Hypertension, Dyslipidemia, and Coronary Artery Disease (Layer4) are identified as diabetes risk factors.
---
## Language Notes
- **Primary Language**: English
- **No other languages detected**
---
## Diagram Components
| Component | Description |
|----------|-------------|
| **Input Fields** | Clinical data entry points (Input1-Input6) |
| **Flowchart Layers** | 5-stage diagnostic process |
| **Color Coding** | Peach (Layer1), Blue (Layer2), Gray (Layers3-5) |
| **Arrows** | Red connections indicating data flow |
---
## Final Diagnosis Path
```
Input Text → Layer1 Tests → Layer2 Abnormal Results → Layer3 Complications → Layer4 Diagnosis → Layer5: Type II Diabetes
```
This visualization appears to implement a clinical decision support system for diabetes risk assessment, mapping test results through progressive layers of diagnostic criteria and complications.