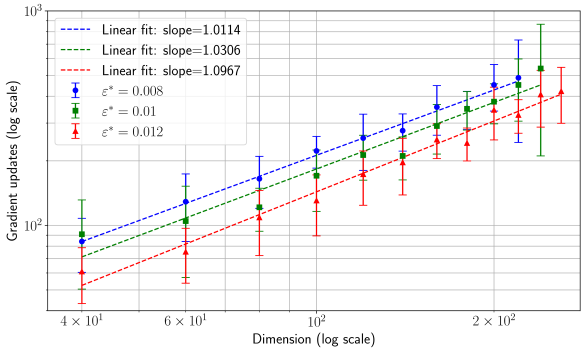
## Log-Log Plot: Gradient Updates vs. Dimension
### Overview
The image is a log-log plot showing the relationship between gradient updates and dimension for different values of epsilon (ε*). The plot includes three data series, each representing a different epsilon value (0.008, 0.01, and 0.012). Each data series displays error bars and a linear fit line with its corresponding slope.
### Components/Axes
* **X-axis:** Dimension (log scale). Axis markers are at 4 x 10^1, 6 x 10^1, 10^2, and 2 x 10^2.
* **Y-axis:** Gradient updates (log scale). Axis markers are at 10^2 and 10^3.
* **Legend (top-left):**
* Blue dashed line: Linear fit: slope = 1.0114
* Green dashed line: Linear fit: slope = 1.0306
* Red dashed line: Linear fit: slope = 1.0967
* Blue circle markers with error bars: ε* = 0.008
* Green square markers with error bars: ε* = 0.01
* Red triangle markers with error bars: ε* = 0.012
### Detailed Analysis
* **Blue Data Series (ε* = 0.008):**
* Trend: The blue data series shows an upward trend.
* Data Points (approximate):
* At Dimension = 4 x 10^1, Gradient Updates ≈ 90
* At Dimension = 6 x 10^1, Gradient Updates ≈ 115
* At Dimension = 10^2, Gradient Updates ≈ 140
* At Dimension = 2 x 10^2, Gradient Updates ≈ 200
* Linear Fit: slope = 1.0114
* **Green Data Series (ε* = 0.01):**
* Trend: The green data series shows an upward trend.
* Data Points (approximate):
* At Dimension = 4 x 10^1, Gradient Updates ≈ 85
* At Dimension = 6 x 10^1, Gradient Updates ≈ 105
* At Dimension = 10^2, Gradient Updates ≈ 135
* At Dimension = 2 x 10^2, Gradient Updates ≈ 180
* Linear Fit: slope = 1.0306
* **Red Data Series (ε* = 0.012):**
* Trend: The red data series shows an upward trend.
* Data Points (approximate):
* At Dimension = 4 x 10^1, Gradient Updates ≈ 65
* At Dimension = 6 x 10^1, Gradient Updates ≈ 80
* At Dimension = 10^2, Gradient Updates ≈ 110
* At Dimension = 2 x 10^2, Gradient Updates ≈ 160
* Linear Fit: slope = 1.0967
### Key Observations
* All three data series exhibit a positive correlation between dimension and gradient updates. As the dimension increases, the number of gradient updates also increases.
* The slopes of the linear fits are all close to 1, indicating an approximately linear relationship on the log-log scale.
* The red data series (ε* = 0.012) has the steepest slope (1.0967), indicating that gradient updates increase more rapidly with dimension for this epsilon value compared to the other two.
* The blue data series (ε* = 0.008) has the shallowest slope (1.0114).
* The error bars indicate the variability in gradient updates for each dimension and epsilon value.
### Interpretation
The plot suggests that the number of gradient updates required increases with the dimension of the problem. The different epsilon values influence the rate at which gradient updates increase with dimension, as indicated by the varying slopes of the linear fits. A higher epsilon value (0.012) leads to a more rapid increase in gradient updates as the dimension increases, while a lower epsilon value (0.008) results in a slower increase. The error bars suggest that there is some variability in the number of gradient updates required for each dimension and epsilon value, which could be due to factors such as the specific problem being solved or the optimization algorithm being used. The slopes being close to 1 indicates a power-law relationship between dimension and gradient updates.