## Chart: Gradient Updates vs. Dimension (Log Scale)
### Overview
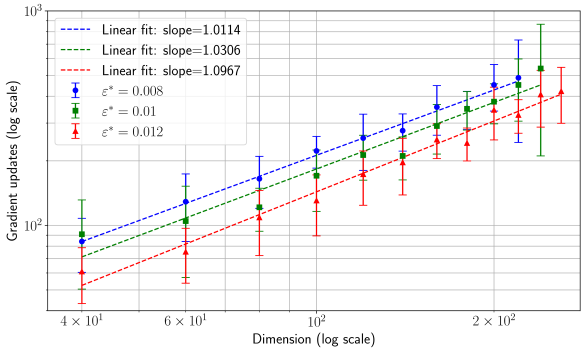
The image presents a chart illustrating the relationship between the dimension (x-axis) and the number of gradient updates (y-axis), both on a logarithmic scale. Three different data series are plotted, each representing a different value of epsilon (ε*). Error bars are included for each data point, indicating the variability or uncertainty in the measurements. Linear fits are shown for each series, with their respective slopes indicated in the legend.
### Components/Axes
* **X-axis:** Dimension (log scale), ranging from approximately 4 x 10¹ to 2 x 10². Axis markers are at 40, 60, 100, and 200.
* **Y-axis:** Gradient updates (log scale), ranging from approximately 10² to 10³. Axis markers are at 100, 1000.
* **Legend:** Located in the top-left corner. Contains the following entries:
* Blue dashed line: "Linear fit: slope=1.0114, ε* = 0.008"
* Green dashed line: "Linear fit: slope=1.0306, ε* = 0.01"
* Red dashed line: "Linear fit: slope=1.0967, ε* = 0.012"
* **Data Series:** Three lines with error bars, each corresponding to a different ε* value.
### Detailed Analysis
The chart displays three data series, each showing an increasing trend as the dimension increases. The error bars indicate the spread of data around each mean value.
**Blue Data Series (ε* = 0.008):**
The blue line slopes upward with a slope of approximately 1.0114.
* Dimension = 40: Gradient Updates ≈ 120, Error ≈ 20
* Dimension = 60: Gradient Updates ≈ 180, Error ≈ 30
* Dimension = 100: Gradient Updates ≈ 300, Error ≈ 50
* Dimension = 200: Gradient Updates ≈ 550, Error ≈ 80
**Green Data Series (ε* = 0.01):**
The green line slopes upward with a slope of approximately 1.0306.
* Dimension = 40: Gradient Updates ≈ 100, Error ≈ 30
* Dimension = 60: Gradient Updates ≈ 150, Error ≈ 40
* Dimension = 100: Gradient Updates ≈ 250, Error ≈ 60
* Dimension = 200: Gradient Updates ≈ 450, Error ≈ 100
**Red Data Series (ε* = 0.012):**
The red line slopes upward with a slope of approximately 1.0967.
* Dimension = 40: Gradient Updates ≈ 80, Error ≈ 20
* Dimension = 60: Gradient Updates ≈ 120, Error ≈ 30
* Dimension = 100: Gradient Updates ≈ 200, Error ≈ 50
* Dimension = 200: Gradient Updates ≈ 400, Error ≈ 80
### Key Observations
* All three data series exhibit a positive correlation between dimension and gradient updates.
* The red data series (ε* = 0.012) consistently shows a higher number of gradient updates for a given dimension compared to the blue (ε* = 0.008) and green (ε* = 0.01) series.
* The slopes of the linear fits are relatively similar, all around 1.0, suggesting a roughly linear relationship between the log of gradient updates and the log of dimension.
* The error bars are larger for higher dimensions, indicating greater variability in the gradient updates.
### Interpretation
The chart suggests that the number of gradient updates required to achieve convergence increases with the dimension of the problem. The different values of epsilon (ε*) represent different settings or parameters within the optimization process. The higher slope for the red series (ε* = 0.012) indicates that a larger epsilon value requires more gradient updates for the same dimension. This could be due to the larger step size leading to overshooting the optimal solution more frequently, thus requiring more iterations to converge.
The approximately linear relationship on the log-log scale implies a power-law relationship between dimension and gradient updates. The slopes of the lines represent the exponent in this power law. The fact that the slopes are close to 1 suggests that the number of gradient updates scales roughly linearly with the dimension.
The increasing error bars with increasing dimension suggest that the optimization process becomes more unstable or sensitive to initial conditions as the dimension grows. This is a common phenomenon in high-dimensional optimization problems. The chart provides valuable insights into the scaling behavior of gradient-based optimization algorithms in high-dimensional spaces and the impact of parameter settings like epsilon on convergence.