## Line Graph: Gradient Updates vs. Dimension (Log-Log Scale)
### Overview
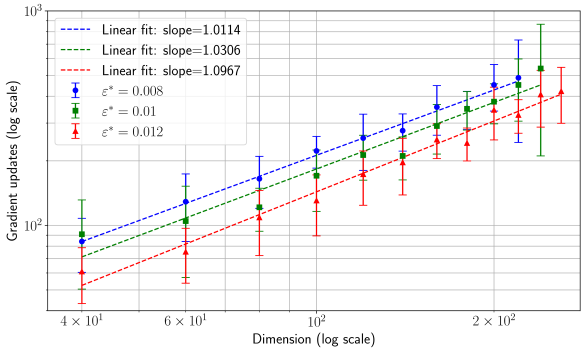
The image is a log-log line graph comparing gradient updates (y-axis) across different dimensions (x-axis) for three distinct parameter settings (ε*). Three linear fits with slopes >1 are plotted, each corresponding to a unique ε* value. The graph includes error bars for data points and legend labels with slope values and ε* parameters.
### Components/Axes
- **X-axis**: "Dimension (log scale)"
- Range: 4×10¹ to 2×10²
- Tick marks at: 4×10¹, 6×10¹, 10², 2×10²
- **Y-axis**: "Gradient updates (log scale)"
- Range: 10² to 10³
- **Legend**: Top-left corner
- Three entries:
1. Blue dashed line: "Linear fit: slope=1.0114" (ε* = 0.008)
2. Green dash-dot line: "Linear fit: slope=1.0306" (ε* = 0.01)
3. Red dotted line: "Linear fit: slope=1.0967" (ε* = 0.012)
### Detailed Analysis
1. **Blue Line (ε* = 0.008)**
- Slope: 1.0114 (shallowest)
- Data points: Start at ~10² gradient updates at 4×10¹ dimension, rising to ~500 at 2×10².
- Error bars: Moderate spread (~10–20% of point values).
2. **Green Line (ε* = 0.01)**
- Slope: 1.0306 (intermediate)
- Data points: Start at ~10² at 4×10¹, reaching ~600 at 2×10².
- Error bars: Slightly larger than blue, especially at higher dimensions.
3. **Red Line (ε* = 0.012)**
- Slope: 1.0967 (steepest)
- Data points: Start at ~10² at 4×10¹, rising to ~800 at 2×10².
- Error bars: Largest spread (~20–30% of point values).
### Key Observations
- All three lines exhibit **upward trends**, confirming a positive correlation between dimension and gradient updates.
- The **red line (ε* = 0.012)** has the steepest slope, indicating the strongest scaling with dimension.
- Error bars increase with dimension for all lines, suggesting greater variability at higher dimensions.
- The linear fits on a log-log scale imply a **power-law relationship** (y ∝ x^slope) between dimension and gradient updates.
### Interpretation
The graph demonstrates that gradient updates scale superlinearly with dimension, with the scaling rate increasing as ε* rises. This suggests that higher ε* values amplify the impact of dimensionality on gradient updates, potentially reflecting trade-offs in optimization efficiency or stability. The error bars highlight experimental uncertainty, which grows with dimension, possibly due to computational noise or model complexity. The slopes (all >1) confirm that gradient updates grow faster than linearly with dimension, a critical insight for resource allocation in high-dimensional systems.