## Line Chart: Correlation Function vs. Distance Between Neurons
### Overview
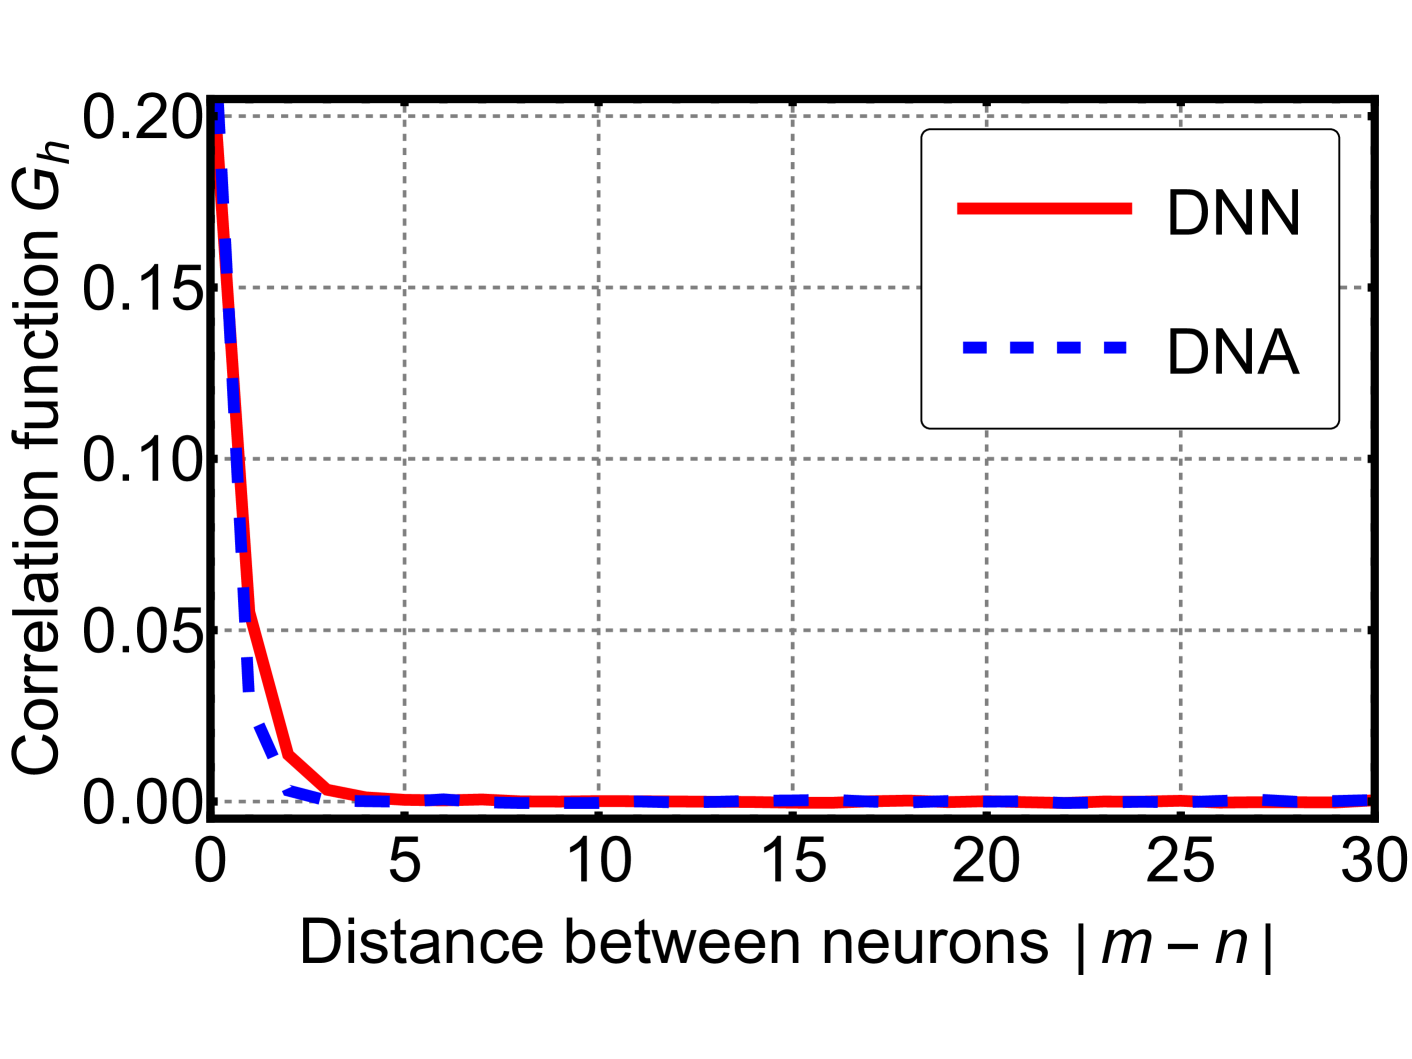
The image is a line chart comparing the correlation function (Gh) against the distance between neurons (|m-n|) for two different models: DNN (Deep Neural Network) and DNA. The chart shows how the correlation function decreases as the distance between neurons increases for both models.
### Components/Axes
* **Title:** There is no explicit title.
* **X-axis:** "Distance between neurons |m-n|"
* Scale: 0 to 30, with tick marks at intervals of 5 (0, 5, 10, 15, 20, 25, 30).
* **Y-axis:** "Correlation function Gh"
* Scale: 0.00 to 0.20, with tick marks at intervals of 0.05 (0.00, 0.05, 0.10, 0.15, 0.20).
* **Legend:** Located in the top-right corner.
* DNN: Represented by a solid red line.
* DNA: Represented by a dashed blue line.
* **Gridlines:** Horizontal and vertical gridlines are present, aiding in value estimation.
### Detailed Analysis
* **DNN (Solid Red Line):**
* Trend: The correlation function decreases rapidly from approximately 0.17 at distance 0 to near 0 at a distance of around 5. It then remains relatively flat and close to 0 for distances greater than 5.
* Data Points:
* At 0 distance: ~0.17
* At 5 distance: ~0.005
* At 10 distance: ~0.002
* At 15 distance: ~0.001
* At 20 distance: ~0.001
* At 25 distance: ~0.001
* At 30 distance: ~0.001
* **DNA (Dashed Blue Line):**
* Trend: The correlation function decreases rapidly from approximately 0.15 at distance 0 to near 0 at a distance of around 5. It then remains relatively flat and close to 0 for distances greater than 5.
* Data Points:
* At 0 distance: ~0.15
* At 5 distance: ~0.008
* At 10 distance: ~0.005
* At 15 distance: ~0.003
* At 20 distance: ~0.002
* At 25 distance: ~0.002
* At 30 distance: ~0.002
### Key Observations
* Both DNN and DNA models show a rapid decrease in correlation function as the distance between neurons increases.
* The DNN model starts with a slightly higher correlation at distance 0 compared to the DNA model.
* Beyond a distance of 5, both models exhibit very low and relatively constant correlation values.
### Interpretation
The data suggests that for both DNN and DNA models, the correlation between neurons is significant only when the neurons are in close proximity. As the distance between neurons increases, the correlation quickly diminishes, indicating a limited range of interaction or dependency between neurons. The slightly higher initial correlation in the DNN model might indicate a stronger initial connectivity or dependency compared to the DNA model, but this difference becomes negligible as the distance increases. The rapid decay in correlation highlights the importance of local interactions within these models.