\n
## Line Chart: Correlation Function vs. Neuron Distance
### Overview
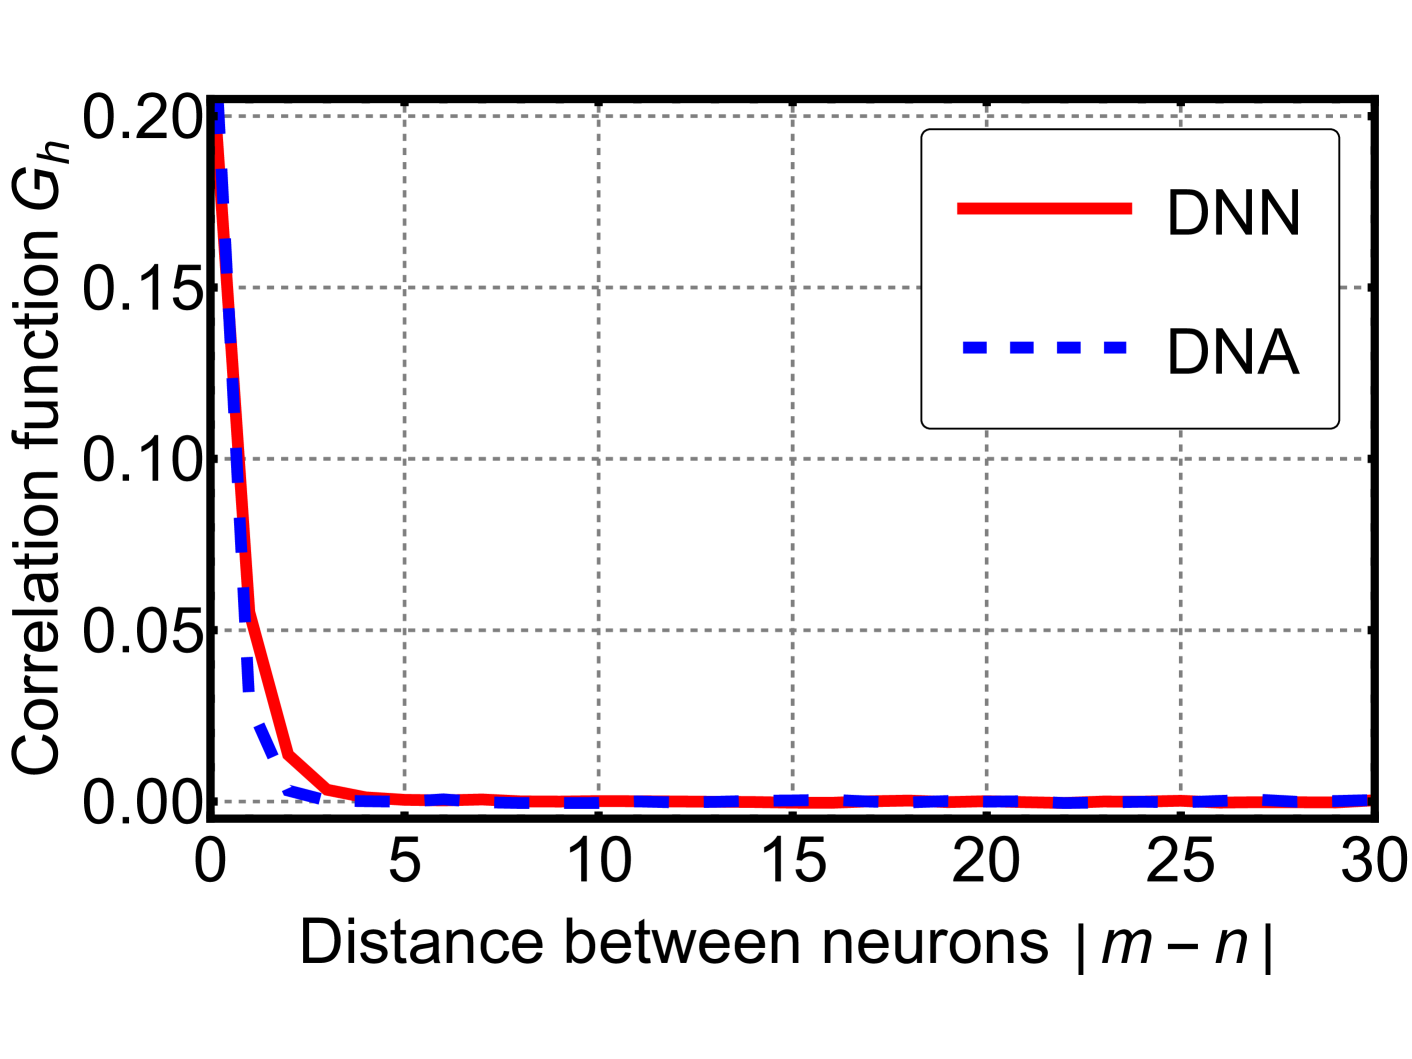
This image presents a line chart illustrating the correlation function (Gh) as a function of the distance between neurons (|m - n|). Two data series are plotted: one representing a Deep Neural Network (DNN) and the other representing DNA. The chart aims to compare the correlation decay with distance for these two systems.
### Components/Axes
* **X-axis:** "Distance between neurons |m - n|". Scale ranges from 0 to 30, with tick marks at 5-unit intervals.
* **Y-axis:** "Correlation function Gh". Scale ranges from 0.00 to 0.20, with tick marks at 0.05-unit intervals.
* **Legend:** Located in the top-right corner.
* Solid Red Line: "DNN"
* Blue Dashed Line: "DNA"
* **Gridlines:** Horizontal and vertical gridlines are present to aid in reading values.
### Detailed Analysis
The chart displays two curves representing the correlation function for DNN and DNA.
**DNN (Solid Red Line):**
The DNN curve starts at approximately 0.18 at a distance of 0, rapidly decreases to approximately 0.05 at a distance of 2, and then plateaus around 0.02-0.03 for distances greater than 5. The line slopes downward initially, then becomes nearly flat.
* Distance = 0: Gh ≈ 0.18
* Distance = 2: Gh ≈ 0.05
* Distance = 5: Gh ≈ 0.03
* Distance = 10: Gh ≈ 0.03
* Distance = 15: Gh ≈ 0.03
* Distance = 20: Gh ≈ 0.03
* Distance = 25: Gh ≈ 0.03
* Distance = 30: Gh ≈ 0.03
**DNA (Blue Dashed Line):**
The DNA curve starts at approximately 0.08 at a distance of 0, decreases more slowly than the DNN curve, reaching approximately 0.02 at a distance of 5, and then continues to decrease gradually, approaching 0.01 at a distance of 20.
* Distance = 0: Gh ≈ 0.08
* Distance = 2: Gh ≈ 0.06
* Distance = 5: Gh ≈ 0.02
* Distance = 10: Gh ≈ 0.015
* Distance = 15: Gh ≈ 0.012
* Distance = 20: Gh ≈ 0.01
* Distance = 25: Gh ≈ 0.008
* Distance = 30: Gh ≈ 0.007
### Key Observations
* The DNN exhibits a much faster decay in correlation with distance compared to DNA.
* The DNN correlation function plateaus at a low value, indicating limited long-range correlation.
* The DNA correlation function decays more gradually, suggesting a more persistent, albeit weaker, correlation over longer distances.
* Both systems show a decrease in correlation as the distance between neurons increases.
### Interpretation
The data suggests that the DNN has a more localized correlation structure than DNA. This means that neurons in a DNN are strongly correlated only when they are close to each other, while neurons in DNA maintain some level of correlation even at larger distances. This difference could be related to the different architectures and learning mechanisms of these two systems. The rapid decay in the DNN correlation function might reflect the localized nature of feature extraction in deep learning, where each layer focuses on specific patterns within a limited receptive field. The slower decay in the DNA correlation function could be related to the long-range interactions and structural properties of DNA. The DNN's correlation function approaching zero at larger distances suggests that the network's information processing is largely independent across distant neurons. The DNA's correlation function never reaching zero suggests some level of interconnectedness even at larger distances.