## Line Graph: Correlation Function vs. Neuron Distance
### Overview
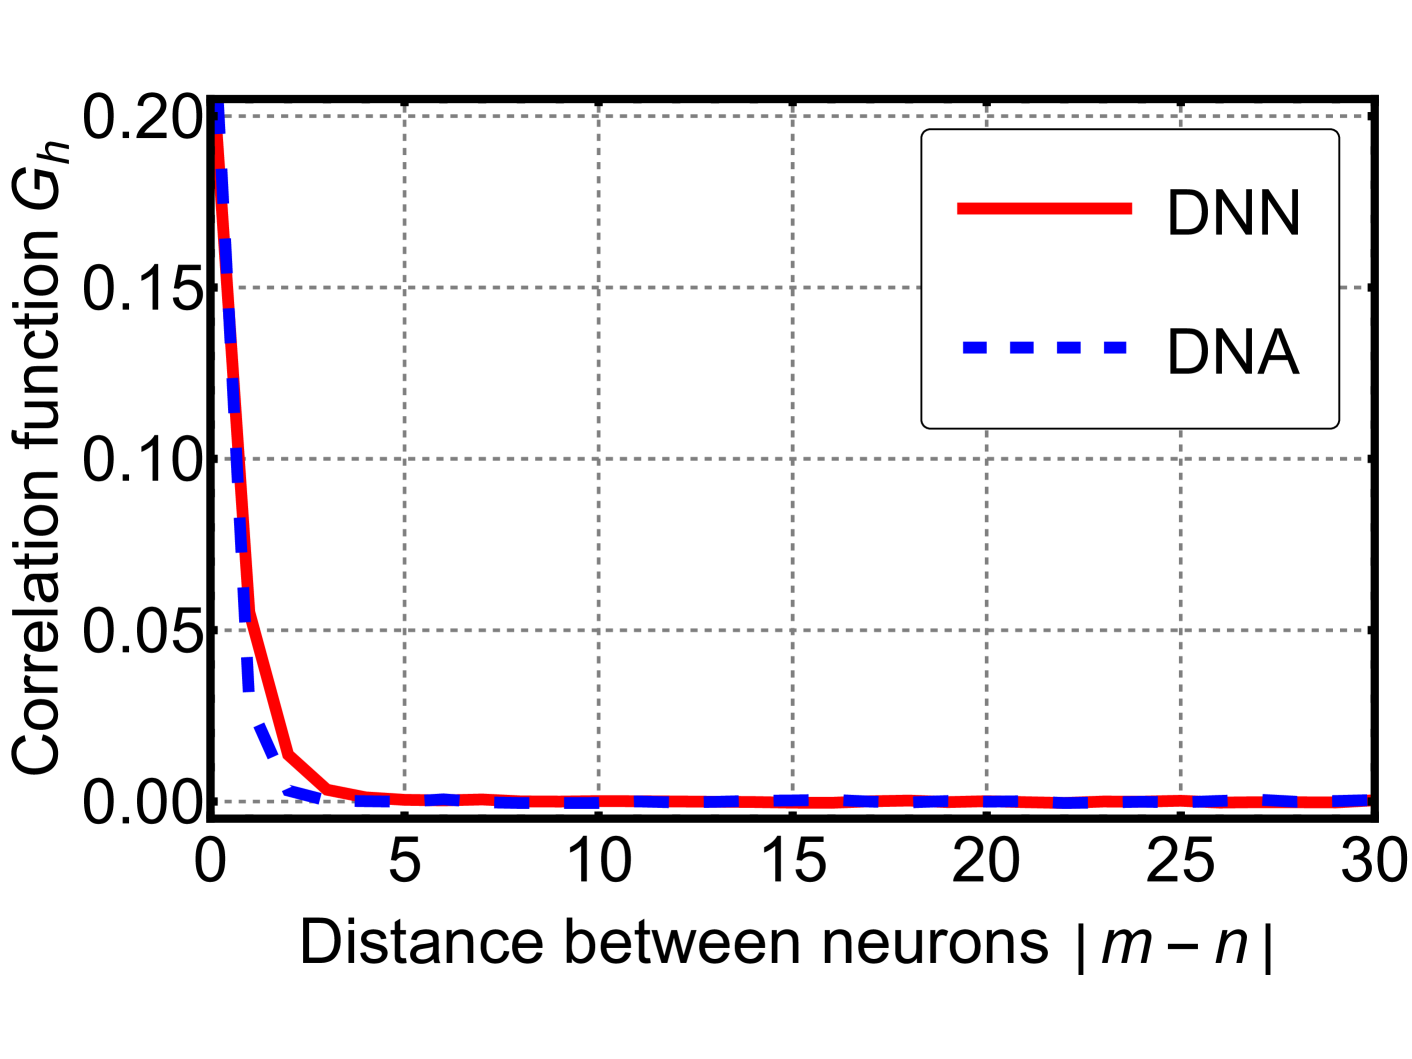
The image displays a 2D line graph comparing the decay of a correlation function, denoted as \(G_h\), as a function of the distance between neurons, denoted as \(|m - n|\). The graph contains two data series, labeled "DNN" and "DNA," both showing a rapid, exponential-like decay from an initial high value at zero distance to near-zero values at larger distances.
### Components/Axes
* **Y-Axis (Vertical):**
* **Label:** "Correlation function \(G_h\)"
* **Scale:** Linear, ranging from 0.00 to 0.20.
* **Major Tick Marks:** 0.00, 0.05, 0.10, 0.15, 0.20.
* **X-Axis (Horizontal):**
* **Label:** "Distance between neurons \(|m - n|\)"
* **Scale:** Linear, ranging from 0 to 30.
* **Major Tick Marks:** 0, 5, 10, 15, 20, 25, 30.
* **Legend:**
* **Position:** Top-right corner of the plot area.
* **Entry 1:** A solid red line labeled "DNN".
* **Entry 2:** A dashed blue line labeled "DNA".
* **Grid:** A light gray, dashed grid is present, aligned with the major tick marks on both axes.
### Detailed Analysis
**Trend Verification & Data Points:**
1. **DNN Series (Solid Red Line):**
* **Trend:** The line exhibits a very steep, concave-upward decay from its maximum at distance 0, flattening out to an asymptote near zero.
* **Approximate Data Points:**
* At distance 0: \(G_h \approx 0.20\)
* At distance 1: \(G_h \approx 0.05\) (estimated from the steep slope)
* At distance 2: \(G_h \approx 0.01\)
* At distance 5 and beyond: \(G_h \approx 0.00\) (visually indistinguishable from the x-axis).
2. **DNA Series (Dashed Blue Line):**
* **Trend:** This line also shows a steep, concave-upward decay, but it decays to near-zero faster than the DNN series.
* **Approximate Data Points:**
* At distance 0: \(G_h \approx 0.18\) (slightly lower than the DNN starting point).
* At distance 1: \(G_h \approx 0.02\)
* At distance 2: \(G_h \approx 0.00\)
* At distance 3 and beyond: \(G_h \approx 0.00\).
**Spatial Grounding:** The two lines are nearly superimposed at the very start (distance 0). The blue dashed line (DNA) drops below the red solid line (DNN) almost immediately and remains below it for the entire visible decay phase (distances 1-4). From approximately distance 5 onward, both lines are flat and overlap at the zero baseline.
### Key Observations
* **Primary Pattern:** Both correlation functions demonstrate a strong, short-range correlation that vanishes rapidly with increasing neuronal distance.
* **Key Difference:** The correlation for the "DNA" series decays to zero more quickly than for the "DNN" series. The DNA correlation is effectively zero by a distance of 2-3, while the DNN correlation reaches a similar near-zero state by a distance of 4-5.
* **Asymptotic Behavior:** For distances greater than 5, both functions are approximately zero, indicating no measurable correlation between neurons separated by 5 or more units in this model.
### Interpretation
This graph quantifies how the similarity or interdependence (correlation) between the activities of neurons diminishes as the neurons become more distant from each other within a network or structure.
* **What the data suggests:** The "DNN" (likely Deep Neural Network) and "DNA" (possibly a different neural architecture or a biological neural analogue) both exhibit **localized correlation**. Information or influence is strongly shared between nearby neurons but does not propagate effectively over long distances within the system.
* **Relationship between elements:** The faster decay of the DNA curve implies its internal correlations are even more spatially restricted than those in the DNN. This could indicate a more modular or locally specialized organization.
* **Notable implication:** The near-zero correlation beyond a short distance (5-10 units) is a critical design or emergent property. It suggests that long-range dependencies in the input data must be captured by other mechanisms (e.g., hierarchical processing across layers, attention mechanisms) rather than by direct, long-range connections within a single layer or region. The graph provides a visual metric for the "receptive field" or "influence radius" of a single neuron's activity within these systems.