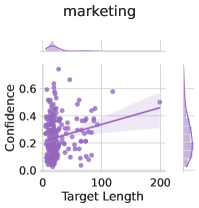
## Scatter Plot: Marketing Confidence vs. Target Length
### Overview
The image is a scatter plot titled "marketing" that visualizes the relationship between "Confidence" and "Target Length." The plot includes marginal distributions (histograms) for both variables. The scatter plot shows individual data points, a regression line, and a confidence interval around the regression line.
### Components/Axes
* **Title:** marketing
* **X-axis:** Target Length
* Scale: 0 to 200, with markers at 0, 100, and 200.
* **Y-axis:** Confidence
* Scale: 0.0 to 0.6, with markers at 0.0, 0.2, 0.4, and 0.6.
* **Data Points:** Each point represents a data entry.
* **Regression Line:** A line showing the general trend of the data.
* **Confidence Interval:** Shaded area around the regression line, indicating the uncertainty in the line's position.
* **Marginal Distributions:**
* Top: Distribution of Target Length.
* Right: Distribution of Confidence.
* **Color:** The data points, regression line, confidence interval, and marginal distributions are all in a light purple color.
### Detailed Analysis
* **Target Length:**
* Ranges from approximately 0 to 200.
* The marginal distribution shows a high concentration of data points at lower values (around 0-20).
* **Confidence:**
* Ranges from approximately 0.0 to 0.6.
* The marginal distribution shows a concentration of data points at lower values (around 0.0-0.2).
* **Scatter Plot:**
* The data points are scattered, with a higher density at lower Target Length values.
* The regression line slopes upward slightly, indicating a positive correlation between Target Length and Confidence.
* The confidence interval widens as Target Length increases, suggesting greater uncertainty in the relationship at higher values.
### Key Observations
* Most data points are clustered at low Target Length and low Confidence values.
* There is a slight positive correlation between Target Length and Confidence, but the relationship is weak.
* The uncertainty in the relationship increases as Target Length increases.
### Interpretation
The scatter plot suggests that there is a weak positive relationship between the target length and confidence. The clustering of data points at low target length values indicates that shorter targets are more common in the dataset. The increasing uncertainty at higher target length values suggests that the relationship between target length and confidence is less reliable for longer targets. The marketing data suggests that shorter marketing targets are more common and tend to have lower confidence scores, while longer targets are less frequent and have a wider range of confidence scores.