\n
## Scatter Plot with Regression: Marketing Confidence vs. Target Length
### Overview
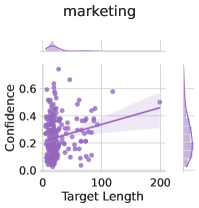
The image is a statistical visualization, specifically a scatter plot with an overlaid linear regression line and its confidence interval. It also includes marginal distribution plots (density curves) for both variables. The chart is titled "marketing" and explores the relationship between "Target Length" and "Confidence."
### Components/Axes
* **Title:** "marketing" (centered at the top).
* **X-Axis:**
* **Label:** "Target Length"
* **Scale:** Linear, ranging from 0 to 200. Major tick marks are visible at 0, 100, and 200.
* **Y-Axis:**
* **Label:** "Confidence"
* **Scale:** Linear, ranging from 0.0 to 0.6. Major tick marks are visible at 0.0, 0.2, 0.4, and 0.6.
* **Data Series:**
* **Scatter Points:** Numerous purple dots representing individual data points.
* **Regression Line:** A solid purple line showing the best-fit linear trend.
* **Confidence Interval:** A semi-transparent purple shaded area surrounding the regression line, representing the uncertainty of the fit.
* **Marginal Plots:**
* **Top (X-axis distribution):** A purple density curve showing the distribution of "Target Length." It is heavily right-skewed, with a high peak near 0 and a long tail extending to the right.
* **Right (Y-axis distribution):** A purple density curve showing the distribution of "Confidence." It is also right-skewed, with the highest density between 0.1 and 0.3.
### Detailed Analysis
* **Data Distribution & Density:**
* The vast majority of data points are clustered in the lower-left quadrant of the plot, where "Target Length" is between 0 and 50 and "Confidence" is between 0.0 and 0.4.
* The density of points decreases significantly as "Target Length" increases beyond 50.
* There are a few scattered points with higher "Target Length" (up to ~200) and varying "Confidence" levels.
* **Regression Trend:**
* The solid purple regression line shows a **positive slope**. It starts at approximately y=0.2 when x=0 and rises to approximately y=0.3 when x=200.
* The shaded confidence interval is narrow at low "Target Length" values (where data is dense) and widens considerably as "Target Length" increases (where data is sparse), indicating greater uncertainty in the trend for longer targets.
* **Marginal Distributions:**
* The top density plot confirms the strong right skew of "Target Length," with a mode near 0.
* The right density plot confirms the right skew of "Confidence," with a mode around 0.2.
### Key Observations
1. **Strong Clustering:** The data is not uniformly distributed. There is a dense cluster of observations for short target lengths (0-50) with low to moderate confidence (0.0-0.4).
2. **Weak Positive Correlation:** The regression line suggests a slight positive relationship: as target length increases, confidence tends to increase marginally. However, the relationship appears weak given the high scatter of points.
3. **Heteroscedasticity:** The spread (variance) of the "Confidence" values appears to increase with "Target Length," as indicated by the widening confidence interval of the regression line.
4. **Data Sparsity:** There are relatively few data points for target lengths greater than 100, making any trend in that region less reliable.
### Interpretation
This chart suggests that within the "marketing" context analyzed, most measured items have short target lengths. There is a tentative, weak positive association between the length of a target (e.g., perhaps a piece of content, a campaign, or a keyword) and the confidence associated with it (e.g., confidence in its performance, targeting accuracy, or success prediction).
The key insight is not a strong predictive relationship, but rather a **descriptive pattern of the data landscape**: the domain is dominated by short targets, and for these, confidence is typically low to moderate. The few long targets show more variable confidence levels. The widening confidence interval cautions against over-interpreting the positive trend for longer targets due to insufficient data. An analyst might conclude that efforts to increase confidence should focus on the common short-target segment, or investigate why data for longer targets is so sparse.