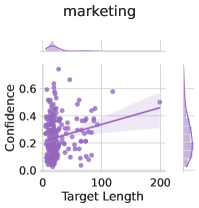
## Scatter Plot: Marketing Confidence vs. Target Length
### Overview
The image displays a scatter plot titled "marketing" with a line of best fit and shaded confidence intervals. The plot examines the relationship between "Target Length" (x-axis) and "Confidence" (y-axis). Data points are represented by purple dots, with a dark purple line of best fit and a light purple shaded area indicating confidence intervals.
### Components/Axes
- **Title**: "marketing" (top-center)
- **X-axis**: "Target Length" (0–200, linear scale)
- **Y-axis**: "Confidence" (0.0–0.6, linear scale)
- **Legend**:
- "Line of Best Fit" (dark purple line)
- "Confidence Intervals" (light purple shaded area)
- **Subplots**:
- Top histogram: Distribution of "Target Length" (purple bars)
- Right histogram: Distribution of "Confidence" (purple bars)
### Detailed Analysis
1. **Line of Best Fit**:
- Slope: Positive (increases from ~0.2 at Target Length 0 to ~0.5 at Target Length 200).
- Equation: Approximately `Confidence = 0.0015 × Target Length + 0.2` (estimated from endpoints).
2. **Confidence Intervals**:
- Width increases with Target Length (e.g., at Target Length 100: 0.3–0.5; at 200: 0.4–0.6).
- Shaded area narrows at lower Target Lengths (0–50) and widens at higher values (150–200).
3. **Data Points**:
- Clustered densely between Target Length 0–100 and Confidence 0.2–0.4.
- Outliers: A few points above the line of best fit (e.g., Target Length 150, Confidence ~0.55).
4. **Histograms**:
- **Target Length**: Peaks at 0–50, with a long tail to 200.
- **Confidence**: Peaks at 0.2–0.4, with fewer points above 0.5.
### Key Observations
- **Positive Correlation**: Confidence increases with Target Length, but the relationship weakens at higher lengths (flatter slope).
- **Increasing Uncertainty**: Confidence intervals grow wider as Target Length increases, indicating greater variability in outcomes.
- **Outliers**: A small number of data points exceed the predicted confidence for their Target Length, suggesting exceptional cases.
### Interpretation
The data suggests that longer Target Lengths generally correlate with higher Confidence in marketing outcomes. However, the widening confidence intervals at higher lengths imply diminishing returns or increased unpredictability. The outliers may represent successful campaigns that defied expectations. The histograms reveal that most campaigns have shorter Target Lengths and moderate Confidence levels, with fewer campaigns achieving high Confidence despite longer efforts. This could indicate a need to reassess strategies for optimizing Target Length to maximize Confidence without excessive resource allocation.