# Technical Document Extraction: Scatter Plot Analysis
## Image Type
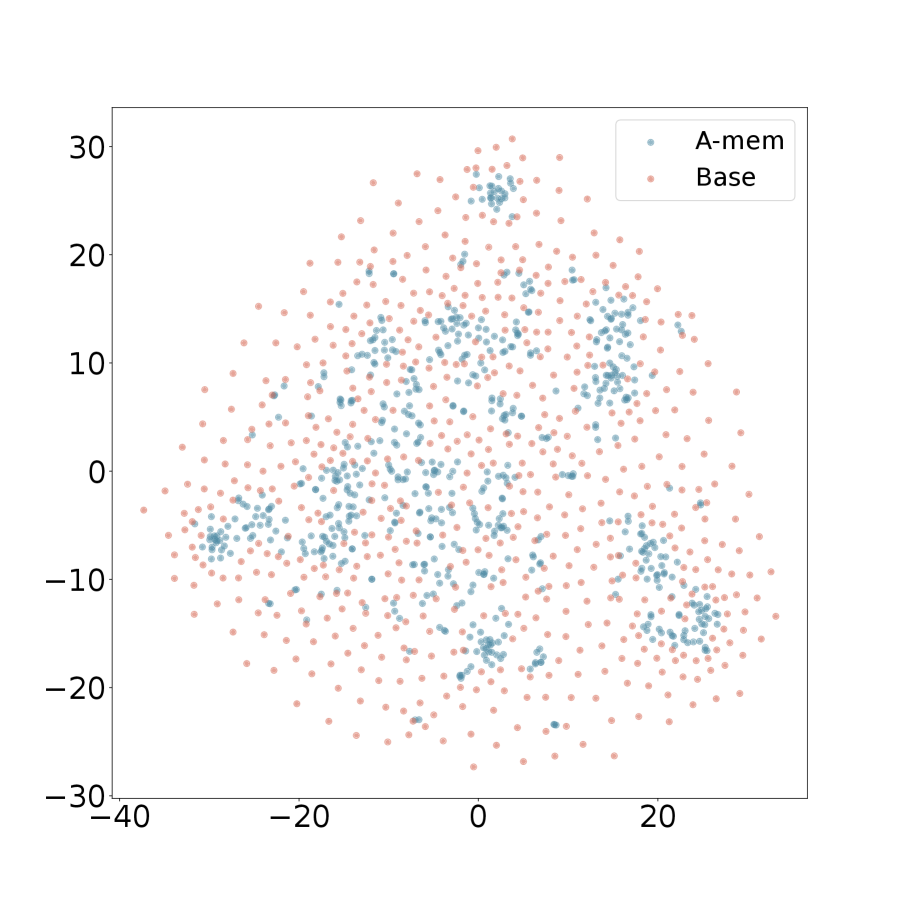
Scatter plot with two distinct data series.
## Axis Labels and Markers
- **X-axis**: Ranges from -40 to 40 (integer increments of 10).
- **Y-axis**: Ranges from -30 to 30 (integer increments of 10).
- **Axis Titles**: No explicit axis titles provided in the image.
## Legend
- **Location**: Top-right corner of the plot.
- **Labels**:
- `A-mem` (blue data points).
- `Base` (orange data points).
## Data Series Analysis
### A-mem (Blue)
- **Distribution**: Clustered primarily in the central region of the plot (approximately between x = -20 to 20 and y = -10 to 20).
- **Density**: Higher concentration of points near the origin (0,0).
- **Trend**: No clear linear or geometric pattern; points are dispersed but denser in the center.
### Base (Orange)
- **Distribution**: Spread across the entire plot, with a higher density near the edges (x ≈ ±30, y ≈ ±20).
- **Trend**: Points form a loose, irregular diamond-like shape, with fewer points concentrated in the central region compared to A-mem.
## Spatial Grounding
- **Legend Position**: [x = 35, y = 30] (top-right corner, outside the main data range).
- **Color Consistency**:
- Blue points match `A-mem` legend label.
- Orange points match `Base` legend label.
## Visual Trends
- **A-mem**: Central clustering suggests a potential focus or anomaly in the dataset.
- **Base**: Edge distribution implies a broader, more uniform sampling across the plot's periphery.
## Additional Notes
- No embedded text, tables, or sub-categories identified.
- No explicit numerical data points provided; analysis based on visual distribution.
- No secondary languages or non-English text detected.
## Conclusion
The plot contrasts two datasets (`A-mem` and `Base`) with distinct spatial distributions. `A-mem` exhibits central clustering, while `Base` shows edge dominance. Further statistical analysis would be required to quantify relationships or correlations.