## Line Chart: Growth of AI Benchmarks by Category (2015-2025)
### Overview
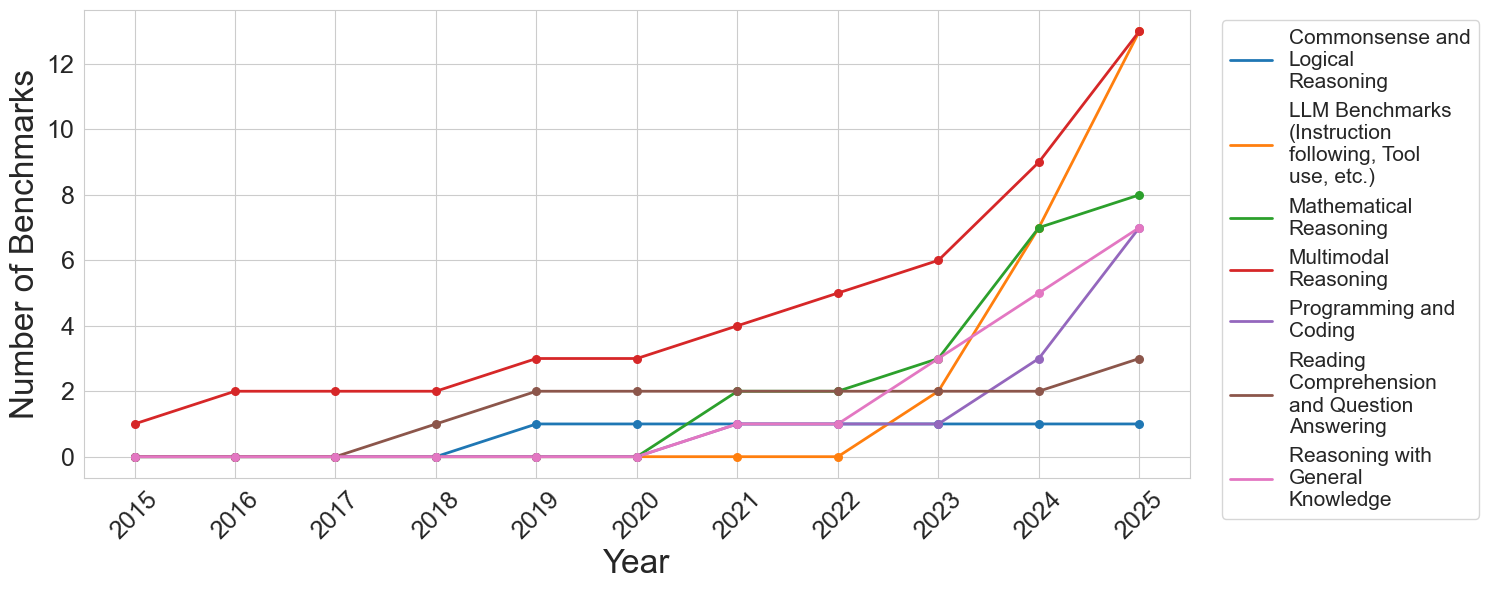
This image is a line chart illustrating the proliferation of different types of artificial intelligence (AI) or machine learning benchmarks over a ten-year period, from 2015 to 2025. It tracks seven distinct categories of benchmarks, showing a general trend of stagnation in early years followed by exponential growth in specific categories starting around 2022-2023.
### Components/Axes
**Spatial Layout:**
* **Main Chart Area:** Occupies the left and center portions of the image. It features a light grey grid with horizontal lines corresponding to the Y-axis major ticks and vertical lines corresponding to the X-axis major ticks.
* **Legend:** Positioned on the far right, outside the main chart grid, enclosed in a subtle grey bounding box.
**Axes:**
* **Y-Axis (Left):**
* **Title:** "Number of Benchmarks" (Rotated 90 degrees counter-clockwise, reading bottom-to-top).
* **Scale:** Linear, ranging from 0 to 12 (with the grid extending slightly above 12 to accommodate a data point at 13).
* **Markers:** 0, 2, 4, 6, 8, 10, 12.
* **X-Axis (Bottom):**
* **Title:** "Year" (Centered below the axis markers).
* **Scale:** Chronological, representing years.
* **Markers:** 2015, 2016, 2017, 2018, 2019, 2020, 2021, 2022, 2023, 2024, 2025. (Text is rotated approximately 45 degrees clockwise).
**Legend (Top-Right to Bottom-Right):**
* **Blue Line:** Commonsense and Logical Reasoning
* **Orange Line:** LLM Benchmarks (Instruction following, Tool use, etc.)
* **Green Line:** Mathematical Reasoning
* **Red Line:** Multimodal Reasoning
* **Purple Line:** Programming and Coding
* **Brown Line:** Reading Comprehension and Question Answering
* **Pink Line:** Reasoning with General Knowledge
---
### Detailed Analysis & Data Extraction
*Note: Data points are extracted based on their alignment with the grid intersections. Values appear to be exact integers.*
**1. Multimodal Reasoning (Red Line)**
* **Visual Trend:** This line starts higher than all others, rises steadily with minor plateaus between 2016-2018 and 2019-2020, and then accelerates sharply upward from 2022 to 2025, ending tied for the highest value.
* **Data Points:** 2015: 1 | 2016: 2 | 2017: 2 | 2018: 2 | 2019: 3 | 2020: 3 | 2021: 4 | 2022: 5 | 2023: 6 | 2024: 9 | 2025: 13
**2. LLM Benchmarks (Instruction following, Tool use, etc.) (Orange Line)**
* **Visual Trend:** This line remains completely flat at zero for the majority of the timeline. It exhibits a sudden, explosive upward spike starting in 2022, tying for the highest value by 2025.
* **Data Points:** 2015-2022: 0 | 2023: 2 | 2024: 7 | 2025: 13
**3. Mathematical Reasoning (Green Line)**
* **Visual Trend:** Flat at zero until 2020, followed by a moderate, steady upward slope through 2025.
* **Data Points:** 2015-2020: 0 | 2021: 2 | 2022: 2 | 2023: 3 | 2024: 7 | 2025: 8
**4. Programming and Coding (Purple Line)**
* **Visual Trend:** Flat at zero until 2019, bumps up slightly to 1, remains flat until 2023, and then slopes sharply upward.
* **Data Points:** 2015-2019: 0 | 2020: 1 | 2021: 1 | 2022: 1 | 2023: 1 | 2024: 3 | 2025: 7
**5. Reasoning with General Knowledge (Pink Line)**
* **Visual Trend:** Flat at zero until 2020, followed by a consistent, moderate upward slope through 2025.
* **Data Points:** 2015-2020: 0 | 2021: 1 | 2022: 1 | 2023: 3 | 2024: 5 | 2025: 7
**6. Reading Comprehension and Question Answering (Brown Line)**
* **Visual Trend:** Flat at zero until 2017, rises slightly to 2 by 2019, plateaus completely for five years, and ticks up slightly in 2025.
* **Data Points:** 2015-2017: 0 | 2018: 1 | 2019: 2 | 2020: 2 | 2021: 2 | 2022: 2 | 2023: 2 | 2024: 2 | 2025: 3
**7. Commonsense and Logical Reasoning (Blue Line)**
* **Visual Trend:** Flat at zero until 2018, rises to 1 in 2019, and remains completely flat at 1 for the rest of the timeline.
* **Data Points:** 2015-2018: 0 | 2019: 1 | 2020-2025: 1
#### Reconstructed Data Table
| Year | Multimodal (Red) | LLM Benchmarks (Orange) | Math (Green) | Programming (Purple) | Gen. Knowledge (Pink) | Reading Comp. (Brown) | Commonsense (Blue) |
| :--- | :--- | :--- | :--- | :--- | :--- | :--- | :--- |
| **2015** | 1 | 0 | 0 | 0 | 0 | 0 | 0 |
| **2016** | 2 | 0 | 0 | 0 | 0 | 0 | 0 |
| **2017** | 2 | 0 | 0 | 0 | 0 | 0 | 0 |
| **2018** | 2 | 0 | 0 | 0 | 0 | 1 | 0 |
| **2019** | 3 | 0 | 0 | 0 | 0 | 2 | 1 |
| **2020** | 3 | 0 | 0 | 1 | 0 | 2 | 1 |
| **2021** | 4 | 0 | 2 | 1 | 1 | 2 | 1 |
| **2022** | 5 | 0 | 2 | 1 | 1 | 2 | 1 |
| **2023** | 6 | 2 | 3 | 1 | 3 | 2 | 1 |
| **2024** | 9 | 7 | 7 | 3 | 5 | 2 | 1 |
| **2025** | 13 | 13 | 8 | 7 | 7 | 3 | 1 |
---
### Key Observations
* **The 2022/2023 Inflection Point:** Almost all categories experience a noticeable acceleration in the number of benchmarks created starting in 2022 or 2023.
* **Explosive Growth of LLM Benchmarks:** The Orange line (LLM Benchmarks) is the most dramatic outlier. It goes from non-existent (0) in 2022 to tying for the highest number of benchmarks (13) in just three years.
* **Dominance of Multimodal:** Multimodal Reasoning (Red) is the only category that had a presence in 2015 and has consistently led or tied for the lead in the number of benchmarks throughout the entire decade.
* **Stagnation of Early NLP Tasks:** "Reading Comprehension" (Brown) and "Commonsense" (Blue) show early, minor growth but plateau entirely from 2019/2020 onward, showing almost no new benchmark development in the later years.
### Interpretation
This chart serves as a visual history of the shifting priorities in Artificial Intelligence research and evaluation over the last decade.
**Reading Between the Lines:**
1. **The Generative AI Boom:** The sudden, violent spike in "LLM Benchmarks" (Orange) starting in 2023 perfectly correlates with the public release of ChatGPT (late 2022) and the subsequent explosion of Large Language Models. Because these models possessed novel capabilities (instruction following, tool use), the old benchmarks were rendered obsolete, necessitating a rapid creation of new evaluation frameworks.
2. **The Shift from Narrow to General/Complex AI:** The stagnation of the Blue (Commonsense) and Brown (Reading Comprehension) lines suggests that these "narrow" NLP problems were either considered "solved" by the research community around 2019/2020, or that they were subsumed by broader, more complex evaluations.
3. **The Push for AGI Metrics:** The sharp rise in Math (Green), Programming (Purple), and General Knowledge (Pink) in the 2023-2025 window indicates that as base language models became fluent, researchers shifted to testing them on rigorous, verifiable logic and reasoning tasks to measure true intelligence rather than just linguistic mimicry.
4. **The Inevitability of Multimodal:** The consistent, leading growth of Multimodal Reasoning (Red) shows that integrating text, vision, and audio has been a long-standing, steadily growing goal of the AI community, which has recently accelerated alongside LLM development (likely reflecting the release of models like GPT-4V and Gemini).
Ultimately, the data demonstrates a paradigm shift: a move away from static, single-task NLP benchmarks toward dynamic, complex, and multi-disciplinary evaluations designed to test the limits of modern foundational models.