## Line Chart: LLM Benchmarks Over Time
### Overview
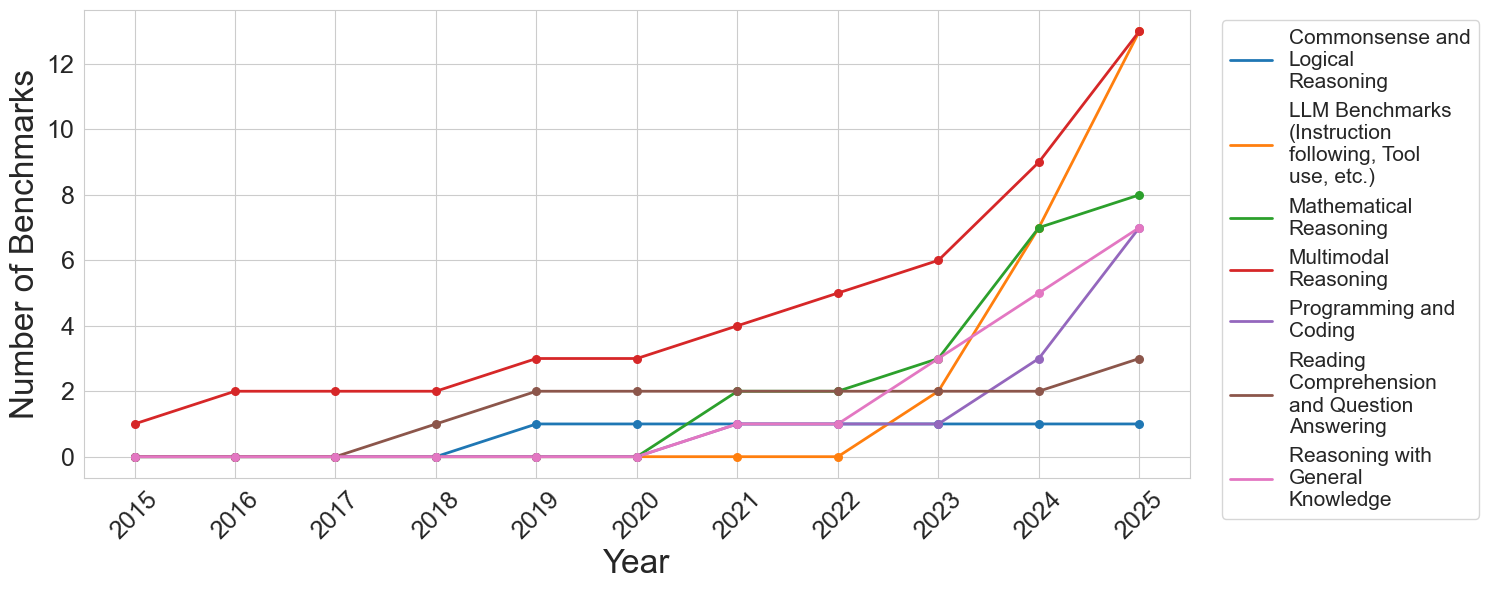
The image is a line chart showing the number of benchmarks for various Large Language Model (LLM) capabilities over the years from 2015 to 2025. The chart tracks trends in Commonsense and Logical Reasoning, LLM Benchmarks (Instruction following, Tool use, etc.), Mathematical Reasoning, Multimodal Reasoning, Programming and Coding, Reading Comprehension and Question Answering, and Reasoning with General Knowledge.
### Components/Axes
* **X-axis:** Year (2015 to 2025)
* **Y-axis:** Number of Benchmarks (0 to 12)
* **Legend (Top-Right):**
* Blue: Commonsense and Logical Reasoning
* Orange: LLM Benchmarks (Instruction following, Tool use, etc.)
* Green: Mathematical Reasoning
* Red: Multimodal Reasoning
* Purple: Programming and Coding
* Brown: Reading Comprehension and Question Answering
* Pink: Reasoning with General Knowledge
### Detailed Analysis
* **Commonsense and Logical Reasoning (Blue):**
* Trend: Stays relatively constant.
* 2015: 0, 2018: 1, 2025: 1
* **LLM Benchmarks (Instruction following, Tool use, etc.) (Orange):**
* Trend: Remains at 0 until 2023, then increases sharply.
* 2015-2022: 0, 2023: 2, 2025: 13
* **Mathematical Reasoning (Green):**
* Trend: Starts at 0, increases significantly after 2023.
* 2015-2023: 0, 2024: 7, 2025: 8
* **Multimodal Reasoning (Red):**
* Trend: Increases steadily over time, with a sharp increase in 2024 and 2025.
* 2015: 1, 2016: 2, 2017: 2, 2018: 2, 2019: 3, 2020: 3, 2021: 4, 2022: 5, 2023: 6, 2024: 9, 2025: 13
* **Programming and Coding (Purple):**
* Trend: Remains at 0 until 2023, then increases.
* 2015-2023: 0, 2024: 3, 2025: 7
* **Reading Comprehension and Question Answering (Brown):**
* Trend: Starts at 0, increases to 2 by 2018, then remains constant.
* 2015-2017: 0, 2018-2025: 2
* **Reasoning with General Knowledge (Pink):**
* Trend: Remains at 0 until 2023, then increases.
* 2015-2023: 0, 2024: 3, 2025: 7
### Key Observations
* Multimodal Reasoning (Red) shows the most significant increase in benchmarks over time.
* LLM Benchmarks (Instruction following, Tool use, etc.) (Orange) and Mathematical Reasoning (Green) show a sharp increase in 2024 and 2025.
* Commonsense and Logical Reasoning (Blue) and Reading Comprehension and Question Answering (Brown) remain relatively constant.
* Programming and Coding (Purple) and Reasoning with General Knowledge (Pink) start increasing later in the period.
### Interpretation
The chart indicates a growing emphasis on benchmarks for LLMs, particularly in areas like Multimodal Reasoning, LLM Benchmarks (Instruction following, Tool use, etc.), and Mathematical Reasoning. The sharp increases in these areas in recent years suggest a focus on developing and evaluating more complex capabilities in LLMs. The relatively constant benchmarks in Commonsense and Logical Reasoning and Reading Comprehension and Question Answering might indicate that these areas are considered more mature or have reached a certain level of performance. The later increase in Programming and Coding and Reasoning with General Knowledge suggests these areas are emerging as important evaluation metrics.