# Technical Document Extraction: Line Chart Analysis
## Chart Overview
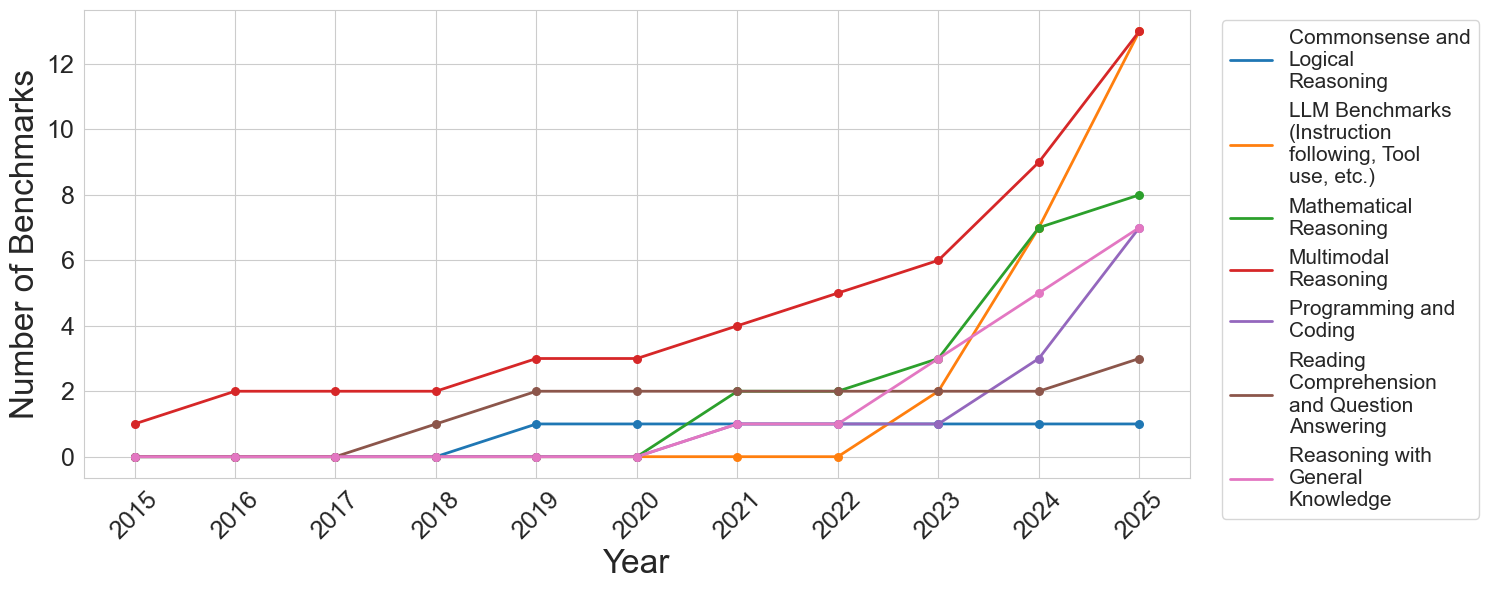
The image depicts a **line chart** visualizing the growth of various AI benchmark categories over time (2015–2025). The chart includes six distinct data series, each represented by a unique color and labeled in the legend.
---
### **Axis Labels**
- **X-axis**: "Year" (2015–2025, annual intervals)
- **Y-axis**: "Number of Benchmarks" (0–14, integer increments)
---
### **Legend**
The legend is positioned on the **right side** of the chart. Colors and labels are as follows:
1. **Blue**: Commonsense and Logical Reasoning
2. **Orange**: LLM Benchmarks (Instruction following, Tool use, etc.)
3. **Green**: Mathematical Reasoning
4. **Red**: Multimodal Reasoning
5. **Purple**: Programming and Coding
6. **Brown**: Reading Comprehension and Question Answering
7. **Pink**: Reasoning with General Knowledge
---
### **Data Series Analysis**
#### 1. **Commonsense and Logical Reasoning (Blue)**
- **Trend**: Flat at 0 until 2019, then increases to 1 in 2020 and remains constant through 2025.
- **Data Points**:
- 2015–2018: 0
- 2019–2025: 1
#### 2. **LLM Benchmarks (Orange)**
- **Trend**: Flat at 0 until 2023, then sharp increase to 3 in 2024 and 13 in 2025.
- **Data Points**:
- 2015–2022: 0
- 2023: 0
- 2024: 3
- 2025: 13
#### 3. **Mathematical Reasoning (Green)**
- **Trend**: Flat at 0 until 2021, then increases to 2 in 2022, 7 in 2024, and 8 in 2025.
- **Data Points**:
- 2015–2020: 0
- 2021: 0
- 2022: 2
- 2023: 3
- 2024: 7
- 2025: 8
#### 4. **Multimodal Reasoning (Red)**
- **Trend**: Steady upward slope from 1 in 2015 to 13 in 2025.
- **Data Points**:
- 2015: 1
- 2016–2018: 2
- 2019–2020: 3
- 2021: 4
- 2022: 6
- 2023: 8
- 2024: 9
- 2025: 13
#### 5. **Programming and Coding (Purple)**
- **Trend**: Flat at 0 until 2024, then increases to 3 in 2024 and 7 in 2025.
- **Data Points**:
- 2015–2023: 0
- 2024: 3
- 2025: 7
#### 6. **Reading Comprehension and Question Answering (Brown)**
- **Trend**: Flat at 0 until 2018, then increases to 1 in 2018, remains constant until 2025, then jumps to 3 in 2025.
- **Data Points**:
- 2015–2017: 0
- 2018–2024: 1
- 2025: 3
#### 7. **Reasoning with General Knowledge (Pink)**
- **Trend**: Flat at 0 until 2024, then increases to 5 in 2024 and 7 in 2025.
- **Data Points**:
- 2015–2023: 0
- 2024: 5
- 2025: 7
---
### **Key Observations**
1. **Multimodal Reasoning (Red)** shows the most consistent growth, doubling every ~3 years.
2. **LLM Benchmarks (Orange)** experience explosive growth in 2024–2025, surpassing all other categories.
3. **Mathematical Reasoning (Green)** and **General Knowledge (Pink)** show late-stage acceleration.
4. **Commonsense/Logical Reasoning (Blue)** and **Programming/Coding (Purple)** remain stagnant until 2020 and 2024, respectively.
---
### **Spatial Grounding**
- **Legend Position**: Right-aligned, outside the main chart area.
- **Data Point Verification**: All line colors match the legend labels exactly. For example, the red line (Multimodal Reasoning) peaks at 13 in 2025, aligning with the legend.
---
### **Conclusion**
The chart highlights divergent growth trajectories across AI benchmarks, with **LLM Benchmarks** and **Multimodal Reasoning** dominating recent advancements. No non-English text or additional data tables are present.