## Composite Figure: Performance Comparison of Popper and Human Methods
### Overview
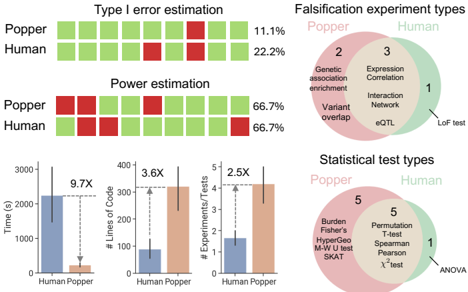
The image presents a composite figure comparing the performance of "Popper" (an automated method) and "Human" methods across several dimensions: Type I error estimation, Power estimation, Falsification experiment types, Statistical test types, Time, Lines of Code, and Number of Experiments/Tests. The figure uses a combination of bar charts, Venn diagrams, and grid-based visualizations to present the data.
### Components/Axes
**1. Type I Error and Power Estimation:**
* **Labels:** "Type I error estimation", "Power estimation", "Popper", "Human", "11.1%", "22.2%", "66.7%"
* **Visualization:** Grid of squares. Green squares indicate correct results, red squares indicate errors.
* **Position:** Top-left of the image.
**2. Falsification Experiment Types:**
* **Title:** "Falsification experiment types"
* **Diagram:** Venn diagram showing the overlap between "Popper" (pink) and "Human" (green).
* **Labels:** "Popper", "Human", "2", "3", "1", "Genetic association enrichment", "Variant overlap", "Expression Correlation", "Interaction Network", "eQTL", "LoF test"
* **Position:** Top-right of the image.
**3. Statistical Test Types:**
* **Title:** "Statistical test types"
* **Diagram:** Venn diagram showing the overlap between "Popper" (pink) and "Human" (green).
* **Labels:** "Popper", "Human", "5", "5", "1", "Burden Fisher's HyperGeo M-W U test SKAT", "Permutation T-test Spearman Pearson X² test", "ANOVA"
* **Position:** Bottom-right of the image.
**4. Time Comparison:**
* **Y-axis:** "Time (s)" with scale from 0 to 3000.
* **X-axis:** "Human", "Popper"
* **Bars:** Blue bar for "Human", tan bar for "Popper". Error bars are present.
* **Annotation:** "9.7X" indicating the fold difference.
* **Position:** Bottom-left of the image.
**5. Lines of Code Comparison:**
* **Y-axis:** "# Lines of Code" with scale from 0 to 400.
* **X-axis:** "Human", "Popper"
* **Bars:** Blue bar for "Human", tan bar for "Popper". Error bars are present.
* **Annotation:** "3.6X" indicating the fold difference.
* **Position:** Bottom-center of the image.
**6. Experiments/Tests Comparison:**
* **Y-axis:** "# Experiments/Tests" with scale from 0 to 5.
* **X-axis:** "Human", "Popper"
* **Bars:** Blue bar for "Human", tan bar for "Popper". Error bars are present.
* **Annotation:** "2.5X" indicating the fold difference.
* **Position:** Bottom-right of the image.
### Detailed Analysis
**1. Type I Error and Power Estimation:**
* **Type I Error:**
* Popper: 11.1% error rate (1 error out of 9 squares).
* Human: 22.2% error rate (2 errors out of 9 squares).
* **Power Estimation:**
* Popper: 66.7% power (6 correct out of 9 squares).
* Human: 66.7% power (6 correct out of 9 squares).
**2. Falsification Experiment Types:**
* **Popper Only (2):** Genetic association enrichment, Variant overlap.
* **Human Only (3):** Expression Correlation, Interaction Network, eQTL.
* **Both (1):** LoF test.
**3. Statistical Test Types:**
* **Popper Only (5):** Burden, Fisher's, HyperGeo, M-W U test, SKAT.
* **Human Only (5):** Permutation, T-test, Spearman, Pearson, X² test.
* **Both (1):** ANOVA.
**4. Time Comparison:**
* Human: Approximately 2200 seconds.
* Popper: Approximately 225 seconds.
* Popper is approximately 9.7 times faster than Human.
**5. Lines of Code Comparison:**
* Human: Approximately 85 lines of code.
* Popper: Approximately 300 lines of code.
* Popper has approximately 3.6 times more lines of code than Human.
**6. Experiments/Tests Comparison:**
* Human: Approximately 1.7 experiments/tests.
* Popper: Approximately 4.2 experiments/tests.
* Popper performs approximately 2.5 times more experiments/tests than Human.
### Key Observations
* Popper has a lower Type I error rate than Human.
* Power estimation is the same for both Popper and Human.
* Popper and Human use different sets of falsification experiments and statistical tests, with only a small overlap.
* Popper is significantly faster than Human.
* Popper requires more lines of code than Human.
* Popper performs more experiments/tests than Human.
### Interpretation
The data suggests that Popper, the automated method, offers advantages in terms of speed and potentially lower Type I error rates. However, it requires more lines of code, indicating greater complexity in its implementation. The Venn diagrams highlight that Popper and Human methods utilize different approaches to falsification experiments and statistical testing, suggesting that they may be suited for different types of analyses or have different biases. The similar power estimation suggests that both methods are equally capable of detecting true effects, but Popper does so more efficiently in terms of time. The choice between Popper and Human methods would depend on the specific research question, the available resources, and the tolerance for Type I errors.