\n
## Comparative Analysis: Popper vs. Human Performance in Statistical Experiments
### Overview
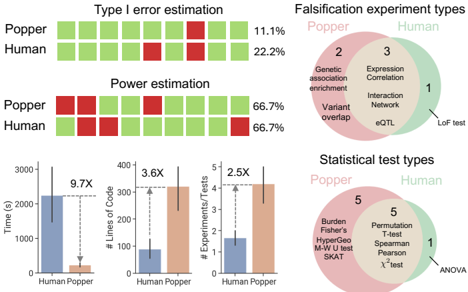
The image presents a comparative analysis of "Popper" (likely a computational method or automated system) versus "Human" performance across several metrics related to statistical experimentation. The analysis includes estimations of Type I error, power, time taken, lines of code required, and the number of experiments/tests performed. Venn diagrams illustrate the types of falsification experiments and statistical tests used in each approach.
### Components/Axes
The image is divided into four main sections:
1. **Type I error estimation:** Visualized as a series of green and red blocks for Popper and Human, with percentage values on the right.
2. **Power estimation:** Similar block visualization as Type I error, with percentage values.
3. **Performance Metrics (Bar Charts):** Three bar charts comparing Human and Popper on Time (seconds), Lines of Code, and Experiments/Tests. Each chart includes a multiplier indicating the relative difference between the two.
4. **Venn Diagrams:** Two Venn diagrams, one for "Falsification experiment types" and one for "Statistical test types", showing the overlap between Popper and Human approaches.
### Detailed Analysis or Content Details
**1. Type I Error Estimation:**
* **Popper:** 11.1% (approximately 1 red block out of 9 total blocks).
* **Human:** 22.2% (approximately 2 red blocks out of 9 total blocks).
**2. Power Estimation:**
* **Popper:** 66.7% (approximately 6 green blocks out of 9 total blocks).
* **Human:** 66.7% (approximately 6 green blocks out of 9 total blocks).
**3. Performance Metrics (Bar Charts):**
* **Time (s):**
* Human: Approximately 2500 seconds (blue bar).
* Popper: Approximately 270 seconds (orange bar).
* Multiplier: 9.7X (indicating Human takes 9.7 times longer).
* **Lines of Code:**
* Human: Approximately 300 lines (blue bar).
* Popper: Approximately 80 lines (orange bar).
* Multiplier: 3.6X (indicating Human requires 3.6 times more code).
* **Experiments/Tests:**
* Human: Approximately 1.6 experiments/tests (blue bar).
* Popper: Approximately 4 experiments/tests (orange bar).
* Multiplier: 2.5X (indicating Popper performs 2.5 times more experiments/tests).
**4. Venn Diagrams:**
* **Falsification Experiment Types:**
* **Popper (Pink):**
* Genetic association enrichment (2 elements)
* Variant overlap (2 elements)
* **Human (Teal):**
* Expression Correlation (3 elements)
* Interaction Network (3 elements)
* eQTL (3 elements)
* **Overlap (Pink/Teal):**
* LoF Test (1 element)
* **Statistical Test Types:**
* **Popper (Pink):**
* Burden (5 elements)
* Permutation (5 elements)
* Fisher's (5 elements)
* HyperGeo (5 elements)
* M-W U test (5 elements)
* SKAT (5 elements)
* **Human (Teal):**
* T-test (5 elements)
* Spearman (5 elements)
* Pearson (5 elements)
* X² test (5 elements)
* **Overlap (Pink/Teal):**
* ANOVA (1 element)
### Key Observations
* Popper demonstrates a lower Type I error rate compared to Human.
* Power estimation is equivalent between Popper and Human.
* Popper significantly outperforms Human in terms of time efficiency (9.7x faster), code conciseness (3.6x fewer lines of code), and experimental throughput (2.5x more experiments).
* The Venn diagrams reveal distinct preferences for experiment and test types between Popper and Human, with minimal overlap.
### Interpretation
The data suggests that Popper is a more efficient and potentially more reliable approach to statistical experimentation compared to Human-driven methods. The lower Type I error rate indicates a reduced risk of false positives, while the superior performance metrics highlight the benefits of automation. The distinct choices in experiment and test types suggest that Popper and Human may be exploring different facets of the problem space or employing different methodologies. The limited overlap in the Venn diagrams indicates that the two approaches are largely complementary rather than redundant. The use of ANOVA as the only shared statistical test suggests a common ground for validation or comparison. The data strongly supports the adoption of automated systems like Popper for accelerating and improving the rigor of statistical analysis.