TECHNICAL ASSET FINGERPRINT
598b2cf2b7867abdf986ee0c
Click to view fullscreen
Press ESC or click to close
FOUND IN PAPERS
EXPERT: healer-alpha-free VERSION 1
RUNTIME: free/openrouter/healer-alpha
INTEL_VERIFIED
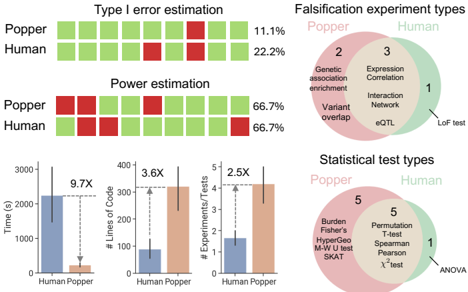
## Multi-Panel Technical Comparison: Popper vs. Human Performance
### Overview
The image is a composite of four distinct panels comparing two entities labeled "Popper" and "Human" across various performance metrics and methodological categories. The panels include two bar chart sets (top-left), a Venn diagram of experiment types (top-right), three comparative bar charts (bottom-left), and a Venn diagram of statistical test types (bottom-right). The overall theme appears to be a benchmarking or methodological comparison, likely in a scientific or computational research context.
### Components/Axes
**Top-Left Panel: Error and Power Estimation**
* **Chart 1 Title:** "Type I error estimation"
* **Rows:** "Popper" (top), "Human" (bottom).
* **Visual Encoding:** A grid of squares. Green squares represent successful/acceptable outcomes, red squares represent failures/errors.
* **Data Labels (Right-aligned):** Popper: 11.1%, Human: 22.2%.
* **Chart 2 Title:** "Power estimation"
* **Rows:** "Popper" (top), "Human" (bottom).
* **Visual Encoding:** Same grid system (green/red squares).
* **Data Labels (Right-aligned):** Popper: 66.7%, Human: 66.7%.
**Top-Right Panel: Falsification Experiment Types**
* **Title:** "Falsification experiment types"
* **Legend/Color Key:** "Popper" (pink circle), "Human" (green circle).
* **Diagram Type:** Three-set Venn diagram.
* **Set Labels & Contents:**
* **Popper-only region (Pink):** Contains the number "2" and the label "Genetic association enrichment".
* **Overlap region (Light Green):** Contains the number "3" and the labels "Expression Correlation", "Interaction Network", "eQTL".
* **Human-only region (Green):** Contains the number "1" and the label "LoF test".
**Bottom-Left Panel: Performance Metrics**
* **Chart 1:**
* **Y-axis:** "Time (s)" (scale 0 to 3000).
* **X-axis Categories:** "Human", "Popper".
* **Data:** Human bar ~2200s, Popper bar ~230s.
* **Annotation:** A dashed line with an arrow and label "9.7X" indicating Popper is 9.7 times faster.
* **Chart 2:**
* **Y-axis:** "# Lines of Code" (scale 0 to 400).
* **X-axis Categories:** "Human", "Popper".
* **Data:** Human bar ~320 lines, Popper bar ~90 lines.
* **Annotation:** "3.6X" indicating Popper uses 3.6 times fewer lines of code.
* **Chart 3:**
* **Y-axis:** "Experiments/Datasets" (scale 0 to 5).
* **X-axis Categories:** "Human", "Popper".
* **Data:** Human bar ~1.2, Popper bar ~3.0.
* **Annotation:** "2.5X" indicating Popper uses 2.5 times more experiments/datasets.
* **Common Element:** All three charts include vertical error bars on the data columns.
**Bottom-Right Panel: Statistical Test Types**
* **Title:** "Statistical test types"
* **Legend/Color Key:** "Popper" (pink circle), "Human" (green circle).
* **Diagram Type:** Two-set Venn diagram.
* **Set Labels & Contents:**
* **Popper-only region (Pink):** Contains the number "5" and the labels "Burden Fisher's", "Hypothesis M-U test", "SKAT".
* **Overlap region (Light Green):** Contains the number "5" and the labels "Permutation T-test", "Spearman Pearson", "χ² test".
* **Human-only region (Green):** Contains no number or specific labels within its exclusive area.
* **External Label:** The label "ANOVA" is placed outside and to the right of the Venn diagram circles.
### Detailed Analysis
**Type I Error & Power Estimation:**
* **Trend Verification:** The "Type I error" grid shows more red squares for "Human" than for "Popper". The "Power estimation" grids show an equal number of red squares for both.
* **Data Points:** Popper's Type I error rate (11.1%) is approximately half that of Human (22.2%). Both Popper and Human achieve an identical Power estimation of 66.7%.
**Falsification Experiment Types:**
* **Spatial Grounding:** The Popper circle is on the left (pink), the Human circle is on the right (green). The overlap is central.
* **Category Breakdown:**
* **Popper-exclusive (2 types):** Genetic association enrichment.
* **Shared (3 types):** Expression Correlation, Interaction Network, eQTL.
* **Human-exclusive (1 type):** LoF test.
**Performance Metrics:**
* **Trend Verification:** For Time and Lines of Code, the "Human" bar is significantly taller than the "Popper" bar. For Experiments/Datasets, the trend is reversed, with the "Popper" bar being taller.
* **Approximate Values & Multipliers:**
* **Time:** Human ~2200s vs. Popper ~230s (Popper is 9.7X faster).
* **Lines of Code:** Human ~320 vs. Popper ~90 (Popper is 3.6X more concise).
* **Experiments/Datasets:** Human ~1.2 vs. Popper ~3.0 (Popper uses 2.5X more).
**Statistical Test Types:**
* **Spatial Grounding:** Popper circle left (pink), Human circle right (green).
* **Category Breakdown:**
* **Popper-exclusive (5 tests):** Burden Fisher's, Hypothesis M-U test, SKAT.
* **Shared (5 tests):** Permutation T-test, Spearman Pearson, χ² test.
* **Human-exclusive:** No tests listed exclusively for Human within its circle.
* **External Test:** ANOVA is listed separately, not contained within either circle.
### Key Observations
1. **Performance Disparity:** "Popper" demonstrates a dramatic efficiency advantage over "Human" in speed (9.7X faster) and code conciseness (3.6X fewer lines), while also employing a broader scope of experiments (2.5X more).
2. **Methodological Overlap & Divergence:** The Venn diagrams show significant overlap in the types of experiments (3 shared) and statistical tests (5 shared) used by both entities. However, each has exclusive methodologies: Popper uses "Genetic association enrichment" and specific tests like "SKAT", while Human uses "LoF tests".
3. **Error Rate Difference:** Popper exhibits a notably lower Type I error rate (11.1% vs. 22.2%), suggesting higher precision or stricter validation, while maintaining identical statistical power (66.7%).
4. **ANOVA's Unique Position:** The statistical test "ANOVA" is the only one listed outside both circles in the bottom-right diagram, indicating it may be a standard or baseline test not specifically attributed to either Popper or Human's exclusive or shared toolkit in this context.
### Interpretation
This composite image presents a compelling case for the superiority of "Popper" (likely an automated tool, algorithm, or framework) over "Human" (likely manual or traditional human-driven processes) in a specific technical domain, possibly bioinformatics or computational biology given terms like "eQTL", "LoF test", and "SKAT".
The data suggests Popper is not only vastly more efficient (faster, less code) but also more rigorous (lower error rate) and more comprehensive (uses more experiments). The Venn diagrams contextualize this by showing that while both approaches share a common core of methods, Popper incorporates specialized techniques (e.g., Genetic association enrichment) and leverages a wider array of experiments. The identical power score indicates that Popper's gains in speed and precision do not come at the cost of statistical sensitivity. The placement of ANOVA outside both circles may imply it is a fundamental test used by both but not considered a distinguishing feature of either's specific methodology. Overall, the image argues for the adoption of the Popper methodology for improved efficiency, scale, and reliability.
DECODING INTELLIGENCE...