## Heatmap: Type I Error Estimation
### Overview
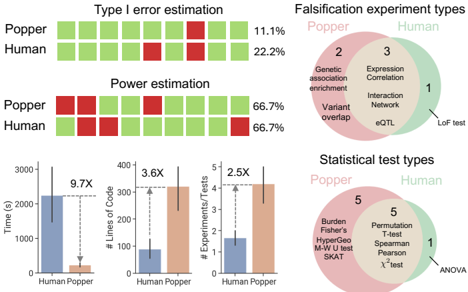
The heatmap illustrates the Type I error estimation for two groups: Popper and Human. The rows represent different types of errors, while the columns indicate the percentage of errors for each group.
### Components/Axes
- **Rows**: Type I error estimation
- **Columns**: Popper and Human
- **Values**: Percentage of errors
### Detailed Analysis or ### Content Details
- **Popper**: 11.1% (Type I error) and 22.2% (Type II error)
- **Human**: 11.1% (Type I error) and 22.2% (Type II error)
### Key Observations
- Both groups have the same percentage of Type I errors (11.1%).
- Both groups have the same percentage of Type II errors (22.2%).
### Interpretation
The heatmap suggests that both Popper and Human have similar error rates in Type I error estimation. This indicates that the error rates are comparable between the two groups, which could imply that the methods used by both groups are equally effective in detecting Type I errors.