\n
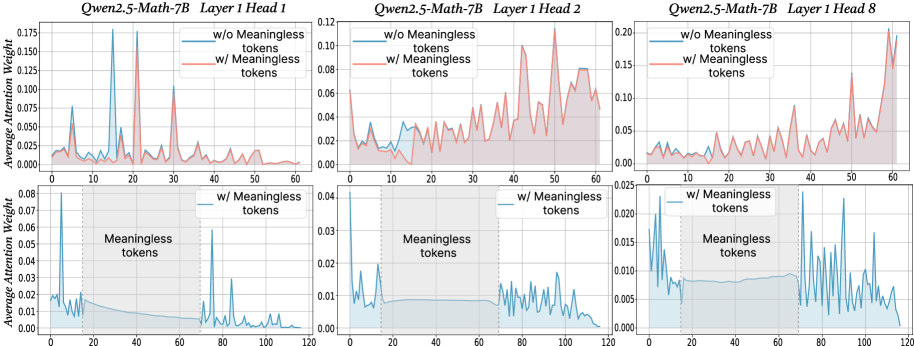
## Line Chart: Attention Weights with and without Meaningless Tokens
### Overview
The image presents three sets of line charts, each comparing the average attention weight with and without "meaningless tokens" for different layers and heads of the Qwen2.5-Math-7B model. Each set contains two charts: one showing attention weights for the entire sequence and another focusing on the region where meaningless tokens are present.
### Components/Axes
Each chart shares the following components:
* **X-axis:** "Tokens" - ranging from 0 to approximately 60-120, depending on the chart.
* **Y-axis:** "Average Attention Weight" - ranging from 0 to approximately 0.20.
* **Legend:**
* "w/o Meaningless tokens" - represented by a reddish-orange line.
* "w/ Meaningless tokens" - represented by a teal line.
* **Titles:** Each chart is titled with "Qwen2.5-Math-7B", "Layer [number]", and "Head [number]".
* **Shaded Region:** A light green shaded region indicates the presence of "Meaningless tokens" in the lower charts.
The three sets of charts correspond to:
1. Layer 1, Head 1
2. Layer 1, Head 2
3. Layer 1, Head 8
### Detailed Analysis or Content Details
**Chart 1: Layer 1, Head 1**
* **Top Chart:** The reddish-orange line ("w/o Meaningless tokens") exhibits several peaks and valleys, fluctuating between approximately 0.01 and 0.15. The teal line ("w/ Meaningless tokens") shows a generally lower attention weight, mostly below 0.05, with some peaks around 0.08.
* **Bottom Chart:** The teal line ("w/ Meaningless tokens") shows a slight increase in attention weight within the shaded region (tokens 20-60), peaking around 0.06, then decreasing again.
**Chart 2: Layer 1, Head 2**
* **Top Chart:** The reddish-orange line ("w/o Meaningless tokens") fluctuates between approximately 0.01 and 0.12. The teal line ("w/ Meaningless tokens") is generally lower, mostly below 0.04, with some peaks around 0.08.
* **Bottom Chart:** The teal line ("w/ Meaningless tokens") shows a slight increase in attention weight within the shaded region (tokens 40-120), peaking around 0.03.
**Chart 3: Layer 1, Head 8**
* **Top Chart:** The reddish-orange line ("w/o Meaningless tokens") fluctuates between approximately 0.01 and 0.20. The teal line ("w/ Meaningless tokens") is generally lower, mostly below 0.025, with some peaks around 0.05.
* **Bottom Chart:** The teal line ("w/ Meaningless tokens") shows a slight increase in attention weight within the shaded region (tokens 40-120), peaking around 0.02.
### Key Observations
* In all charts, the attention weights are generally higher when meaningless tokens are *not* present ("w/o Meaningless tokens").
* The presence of meaningless tokens ("w/ Meaningless tokens") appears to slightly increase attention weight in the region where they are located, but the overall attention weight remains lower compared to the case without meaningless tokens.
* The magnitude of attention weights varies significantly between different heads (Head 1, Head 2, Head 8). Head 8 shows the highest overall attention weights.
* The fluctuations in attention weights suggest that the model attends to different parts of the input sequence at different times.
### Interpretation
The data suggests that the Qwen2.5-Math-7B model assigns lower attention weights to meaningless tokens compared to meaningful tokens. This is expected, as the model is likely designed to focus on relevant information. The slight increase in attention weight within the region of meaningless tokens could be due to the model attempting to process or filter out these tokens.
The differences in attention weight magnitudes between different heads indicate that different heads may be responsible for attending to different aspects of the input sequence. Head 8, with its higher attention weights, may be more sensitive to the overall input or may be responsible for capturing more important features.
The fluctuations in attention weights highlight the dynamic nature of the attention mechanism, which allows the model to adapt its focus based on the input sequence. The charts provide insights into how the model processes information and how it handles meaningless tokens. The consistent pattern across all three heads suggests a robust behavior of the model.