## Line Graphs: Qwen2.5-Math-7B Layer 1 Head Attention Weights
### Overview
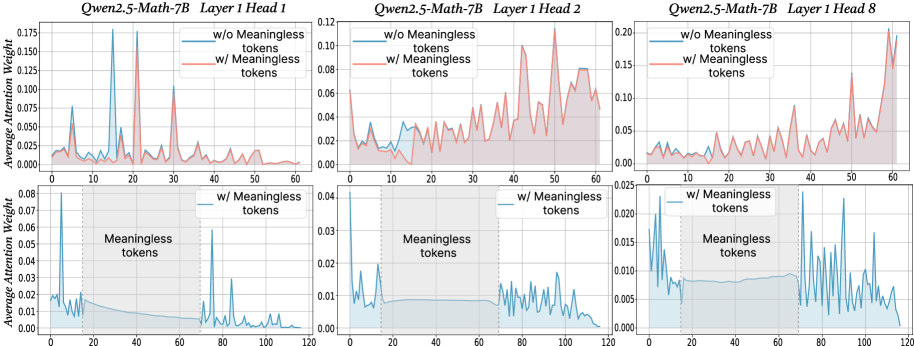
The image contains six line graphs comparing attention weight distributions across token positions (0-120) for three attention heads (Head 1, Head 2, Head 8) in a Qwen2.5-Math-7B model. Each graph contrasts two conditions:
- **Blue line**: Attention weights without meaningless tokens
- **Red line**: Attention weights with meaningless tokens
The graphs are split into two sections:
1. **Top row**: Full token position range (0-120)
2. **Bottom row**: Zoomed-in view of the "Meaningless tokens" region (20-40)
---
### Components/Axes
- **X-axis**: Token Position (0-120)
- **Y-axis**: Average Attention Weight (0.00-0.175)
- **Legends**:
- Blue: "w/o Meaningless tokens"
- Red: "w/ Meaningless tokens"
- **Shaded areas**: Confidence intervals (bottom row only)
---
### Detailed Analysis
#### Head 1 (Top Left)
- **Blue line**: Sharp peaks at token positions ~20 and ~40 (attention weights ~0.15-0.175).
- **Red line**: Broader, less pronounced peaks (max ~0.125).
- **Bottom graph**: Blue line shows concentrated peaks in 20-40 range; red line has diffuse, lower peaks.
#### Head 2 (Top Center)
- **Blue line**: Gradual rise to ~0.125 at token 60, then decline.
- **Red line**: Noisy baseline (~0.05-0.08) with minor spikes.
- **Bottom graph**: Blue line remains stable in 20-40 range; red line shows erratic fluctuations.
#### Head 8 (Top Right)
- **Blue line**: Sparse peaks at ~10, ~50, and ~100 (weights ~0.10-0.15).
- **Red line**: Continuous noise with occasional spikes (max ~0.12).
- **Bottom graph**: Blue line has minimal activity in 20-40 range; red line shows sporadic peaks.
---
### Key Observations
1. **Head 1**:
- Meaningless tokens (red) reduce peak sharpness and magnitude compared to the no-meaningless-token condition (blue).
- Attention is more distributed in the meaningless-token region.
2. **Head 2**:
- Meaningless tokens introduce noise, flattening the attention curve.
- No meaningful peaks in the 20-40 range for either condition.
3. **Head 8**:
- Meaningless tokens disrupt the sparse, periodic peaks seen in the no-meaningless-token condition.
- Attention becomes more erratic in the meaningless-token region.
---
### Interpretation
The data suggests that **meaningless tokens disrupt attention patterns** in all three heads:
- **Head 1**: Focuses on specific tokens (e.g., 20, 40) but loses precision with meaningless tokens.