## Line Chart: Average Liar Score vs. Layer Index
### Overview
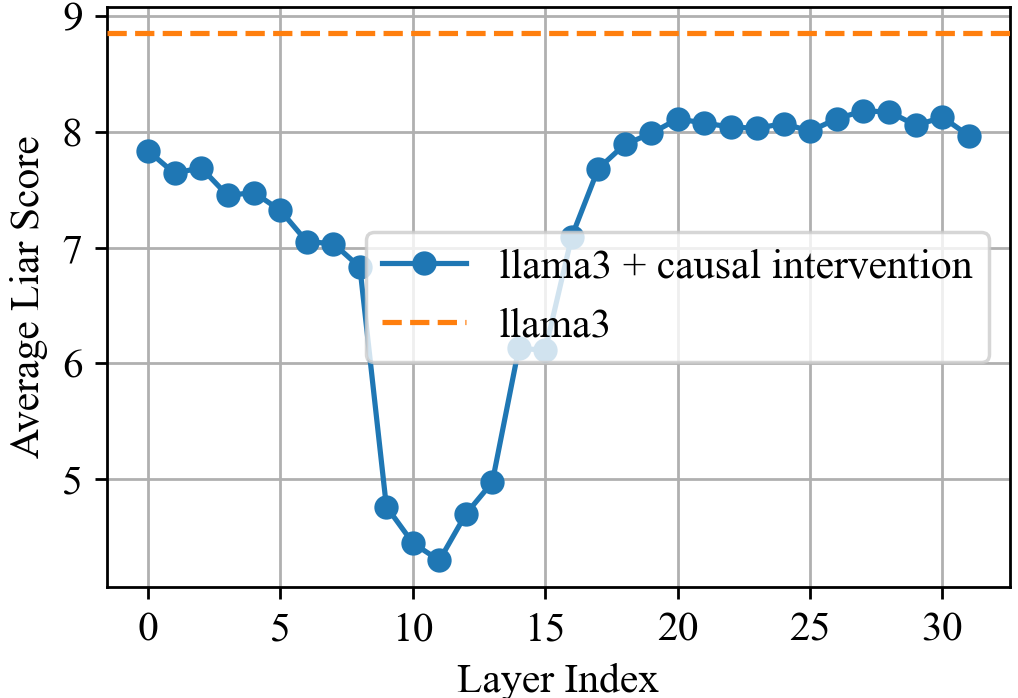
The image is a line chart comparing the "Average Liar Score" of two configurations of the Llama3 model across different "Layer Index" values. One configuration is "llama3 + causal intervention," and the other is "llama3." The chart shows how the average liar score changes as the layer index increases.
### Components/Axes
* **X-axis (Horizontal):** "Layer Index". The axis ranges from 0 to 30, with tick marks at intervals of 5 (0, 5, 10, 15, 20, 25, 30).
* **Y-axis (Vertical):** "Average Liar Score". The axis ranges from 5 to 9, with tick marks at intervals of 1 (5, 6, 7, 8, 9).
* **Legend (Center-Right):**
* Blue line with circular markers: "llama3 + causal intervention"
* Dashed orange line: "llama3"
### Detailed Analysis
* **llama3 + causal intervention (Blue Line):**
* **Trend:** The line starts at approximately 7.8 at Layer Index 0, gradually decreases to a minimum of approximately 4.4 at Layer Index 10, then increases to a plateau around 8.1 at Layer Index 20, and remains relatively stable until Layer Index 30.
* **Data Points:**
* Layer Index 0: Average Liar Score ≈ 7.8
* Layer Index 5: Average Liar Score ≈ 7.3
* Layer Index 10: Average Liar Score ≈ 4.4
* Layer Index 15: Average Liar Score ≈ 6.2
* Layer Index 20: Average Liar Score ≈ 8.1
* Layer Index 25: Average Liar Score ≈ 8.2
* Layer Index 30: Average Liar Score ≈ 8.0
* **llama3 (Dashed Orange Line):**
* **Trend:** The line is almost horizontal, indicating a constant "Average Liar Score" across all "Layer Index" values.
* **Data Points:**
* The "Average Liar Score" for "llama3" remains constant at approximately 8.8 across all layer indices.
### Key Observations
* The "llama3 + causal intervention" configuration shows a significant dip in the "Average Liar Score" around Layer Index 10, indicating a potential vulnerability or change in behavior at that layer.
* The "llama3" configuration maintains a consistently high "Average Liar Score" across all layers.
* The "llama3 + causal intervention" configuration recovers to a similar, but slightly lower, "Average Liar Score" as the "llama3" configuration after Layer Index 20.
### Interpretation
The chart suggests that causal intervention in the Llama3 model significantly impacts the "Average Liar Score" at specific layers, particularly around Layer Index 10. The intervention initially reduces the "Average Liar Score," but the model recovers as the layer index increases. The consistent "Average Liar Score" of the "llama3" configuration indicates a stable baseline performance. The dip in the "llama3 + causal intervention" line could indicate a layer where the model's behavior is more susceptible to manipulation or where the intervention has a more pronounced effect. The recovery suggests that the model adapts or compensates for the intervention in later layers.