# Technical Document Extraction: Model Performance Analysis
## 1. Image Overview
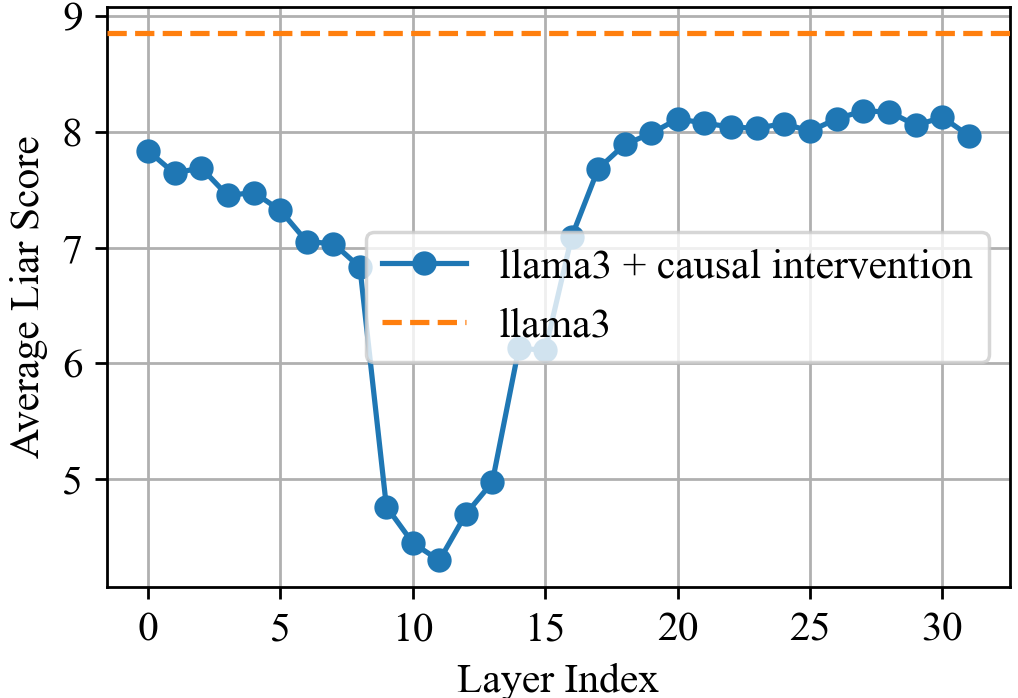
This image is a line graph illustrating the impact of a "causal intervention" on the "Average Liar Score" across different layers of the **llama3** large language model. The chart compares a baseline performance against a modified version of the model.
## 2. Component Isolation
### Header / Metadata
* **Language:** English.
* **Subject:** Comparative analysis of llama3 model layers.
### Main Chart Area
* **X-Axis (Horizontal):**
* **Label:** Layer Index
* **Markers:** 0, 5, 10, 15, 20, 25, 30
* **Y-Axis (Vertical):**
* **Label:** Average Liar Score
* **Markers:** 5, 6, 7, 8, 9
* **Grid:** A light gray rectangular grid is present to facilitate data point estimation.
### Legend
* **Spatial Placement:** Located in the center-right of the plot area.
* **Series 1:** Blue solid line with circular markers (`-o`) labeled "**llama3 + causal intervention**".
* **Series 2:** Orange dashed line (`--`) labeled "**llama3**".
---
## 3. Data Series Analysis and Trends
### Series 1: llama3 (Baseline)
* **Visual Trend:** A horizontal dashed orange line. It remains constant across all layer indices.
* **Value:** Approximately **8.8** on the Average Liar Score scale.
* **Interpretation:** This represents the default performance of the llama3 model without any intervention, serving as a control.
### Series 2: llama3 + causal intervention
* **Visual Trend:** This series exhibits a "U-shaped" or "V-shaped" dip.
* **Initial Phase (Layers 0-8):** Starts at ~7.8 and shows a gradual, steady decline.
* **Drop Phase (Layers 9-11):** A sharp, steep decline occurs.
* **Nadir (Layer 11):** The score reaches its lowest point.
* **Recovery Phase (Layers 12-17):** A sharp, steep increase back toward the baseline.
* **Stabilization Phase (Layers 18-31):** The score plateaus, fluctuating slightly between 8.0 and 8.2, remaining below the original baseline.
| Layer Index | Estimated Average Liar Score (Intervention) |
| :--- | :--- |
| 0 | ~7.8 |
| 5 | ~7.3 |
| 10 | ~4.5 |
| 11 (Minimum) | ~4.3 |
| 15 | ~6.1 |
| 20 | ~8.1 |
| 31 | ~8.0 |
---
## 4. Summary of Findings
The data indicates that the "causal intervention" significantly reduces the "Average Liar Score," particularly in the middle layers of the model. The most profound effect is observed between **Layer 9 and Layer 15**, with the peak effectiveness (lowest score) occurring at **Layer 11**. While the intervention's effect diminishes in the later layers (20-31), the score still remains lower than the baseline llama3 model (orange dashed line).