\n
## Line Chart: Average Liar Score vs. Layer Index
### Overview
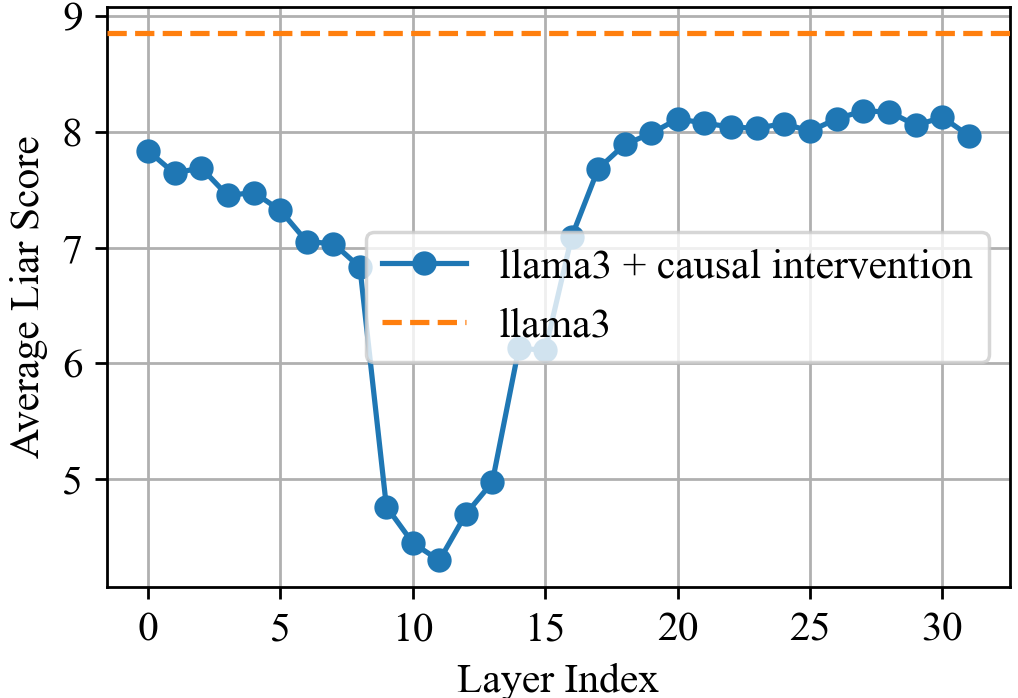
This chart compares the "Average Liar Score" of two models, "llama3" and "llama3 + causal intervention", across different "Layer Index" values. The chart displays the data as two line graphs, allowing for a visual comparison of their performance.
### Components/Axes
* **X-axis:** "Layer Index" - Ranges from approximately 0 to 30. The axis is labeled at increments of 5.
* **Y-axis:** "Average Liar Score" - Ranges from approximately 3 to 9. The axis is labeled at increments of 1.
* **Line 1 (Blue):** "llama3 + causal intervention" - Represents the average liar score for the model with causal intervention.
* **Line 2 (Orange, Dashed):** "llama3" - Represents the average liar score for the base llama3 model.
* **Legend:** Located in the center-right of the chart, clearly identifying each line with its corresponding label and color.
### Detailed Analysis
**llama3 + causal intervention (Blue Line):**
The blue line starts at approximately 7.9 at Layer Index 0. It generally decreases until it reaches a minimum of approximately 4.3 at Layer Index 10. From Layer Index 10, the line increases, reaching approximately 8.2 at Layer Index 20. It then fluctuates between approximately 8.1 and 8.5 until Layer Index 30, ending at approximately 8.4.
* Layer Index 0: ~7.9
* Layer Index 5: ~7.2
* Layer Index 10: ~4.3
* Layer Index 15: ~7.4
* Layer Index 20: ~8.2
* Layer Index 25: ~8.3
* Layer Index 30: ~8.4
**llama3 (Orange, Dashed Line):**
The orange dashed line remains relatively constant at approximately 8.9 throughout the entire range of Layer Indices (0 to 30).
* Layer Index 0: ~8.9
* Layer Index 5: ~8.9
* Layer Index 10: ~8.9
* Layer Index 15: ~8.9
* Layer Index 20: ~8.9
* Layer Index 25: ~8.9
* Layer Index 30: ~8.9
### Key Observations
* The "llama3 + causal intervention" model exhibits a significant decrease in "Average Liar Score" between Layer Index 0 and Layer Index 10, indicating a potential reduction in deceptive behavior or a change in the model's response.
* The "llama3" model maintains a consistently high "Average Liar Score" across all layers.
* After Layer Index 10, the "llama3 + causal intervention" model's score increases and approaches the level of the "llama3" model, but remains slightly lower.
* The difference in scores between the two models is most pronounced between Layer Index 5 and Layer Index 20.
### Interpretation
The data suggests that the causal intervention applied to the "llama3" model has a notable impact on its "Average Liar Score," particularly in the initial layers. The initial decrease indicates that the intervention effectively reduces the model's tendency to generate deceptive responses. However, as the layer index increases, the effect of the intervention diminishes, and the "Average Liar Score" begins to converge with that of the original "llama3" model. This could imply that the intervention's influence is more pronounced in the earlier stages of processing or that the model gradually reverts to its original behavior as information propagates through deeper layers. The consistently high score of the base "llama3" model suggests that it inherently exhibits a higher propensity for generating responses that are classified as "liar" behavior, as measured by this metric. The chart provides evidence that causal interventions can be a viable strategy for mitigating deceptive tendencies in language models, but their effectiveness may be limited by the model's architecture and the depth of the intervention.