## Line Graph: Average Liar Score vs. Layer Index
### Overview
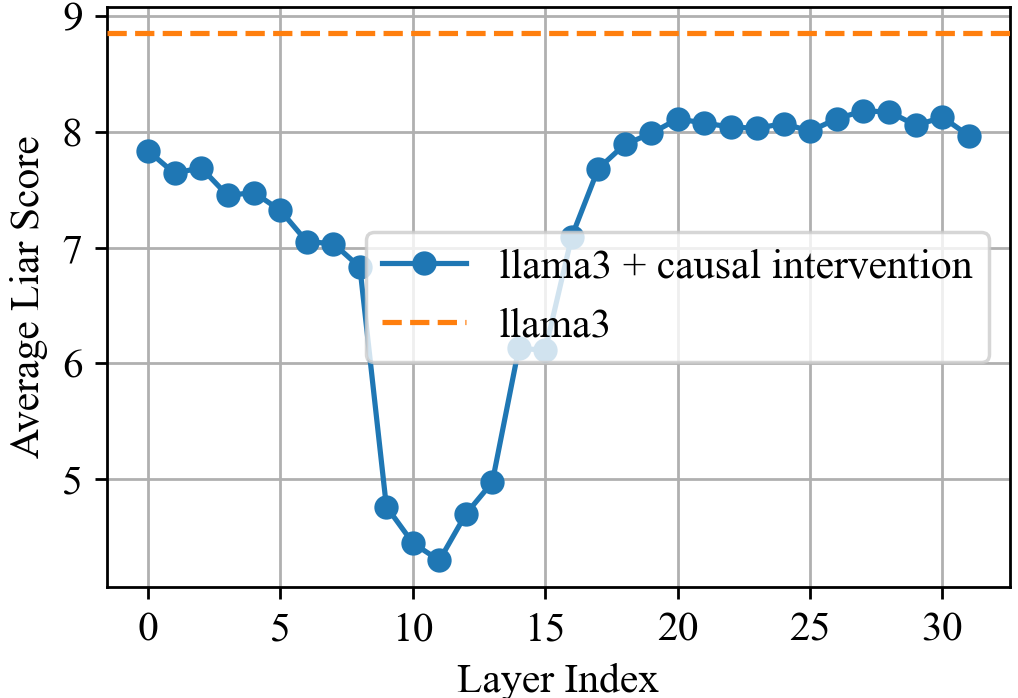
The graph compares two data series across 31 layers (Layer Index 0–30):
1. **llama3 + causal intervention** (solid blue line)
2. **llama3** (dashed orange line)
The y-axis measures "Average Liar Score" (4–9), while the x-axis represents sequential layers in a model.
---
### Components/Axes
- **X-axis (Layer Index)**:
- Range: 0 to 30 (increments of 5)
- Labels: "Layer Index"
- **Y-axis (Average Liar Score)**:
- Range: 4 to 9 (increments of 1)
- Labels: "Average Liar Score"
- **Legend**:
- Position: Top-right corner
- Entries:
- Solid blue: "llama3 + causal intervention"
- Dashed orange: "llama3"
---
### Detailed Analysis
#### Data Series 1: llama3 + causal intervention (blue line)
- **Trend**:
- Starts at ~7.8 (Layer 0)
- Sharp decline to ~4.5 (Layer 10)
- Rapid recovery to ~8.2 (Layer 30)
- **Key Points**:
- Minimum: ~4.5 (Layer 10)
- Maximum: ~8.2 (Layer 30)
- Notable dip between Layers 5–15
#### Data Series 2: llama3 (orange dashed line)
- **Trend**:
- Constant value of ~8.8 across all layers
- No variation observed
---
### Key Observations
1. **Initial Dip**: The "llama3 + causal intervention" series drops ~3.3 points (from 7.8 to 4.5) between Layers 0–10.
2. **Recovery Phase**: The same series surpasses the baseline (~8.8) by Layer 25, reaching ~8.2.
3. **Baseline Stability**: The "llama3" series remains flat at ~8.8, indicating no inherent change over layers.
4. **V-Shape Pattern**: The intervention series exhibits a pronounced V-shaped trajectory, suggesting a temporary negative impact followed by improvement.
---
### Interpretation
- **Causal Intervention Impact**:
- The initial decline may reflect a "calibration period" where the intervention disrupts existing patterns.
- The subsequent recovery and surpassing of the baseline (~8.8) implies the intervention ultimately enhances performance, possibly by addressing systemic biases or inaccuracies in the original model.
- **Layer-Specific Behavior**:
- The trough at Layer 10 suggests a critical layer where the intervention’s effects are most pronounced.
- The recovery phase (Layers 15–30) indicates gradual stabilization and optimization.
- **Practical Implications**:
- The intervention’s effectiveness grows with depth, hinting at layer-specific mechanisms (e.g., attention redistribution, bias correction).
- The flat baseline underscores the necessity of intervention for sustained improvement.
---
### Spatial Grounding & Validation
- **Legend Alignment**:
- Blue line matches "llama3 + causal intervention"
- Orange dashed line matches "llama3"
- **Axis Consistency**:
- Layer Index increments (0–30) align with x-axis ticks.
- Y-axis values (4–9) match data point ranges.
---
### Uncertainties
- Exact values at Layer 10 (minimum) and Layer 30 (peak) are approximate (±0.1).
- The orange line’s constant value assumes no hidden variation in the baseline model.