## Diagram: State Transition Diagram
### Overview
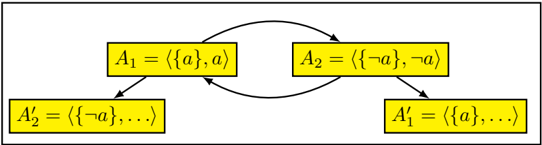
The image is a state transition diagram showing the relationships between four states, labeled A1, A2, A'1, and A'2. The states are represented by yellow rectangles, and the transitions between them are indicated by arrows.
### Components/Axes
* **States:** A1, A2, A'1, A'2 (represented as yellow rectangles)
* **Transitions:** Arrows indicating the flow between states.
* **State Contents:** Each state contains a mathematical expression within angle brackets.
### Detailed Analysis or ### Content Details
* **State A1 (top-left):** Contains the expression "⟨{a}, a⟩".
* **State A2 (top-right):** Contains the expression "⟨{¬a}, ¬a⟩".
* **State A'2 (bottom-left):** Contains the expression "⟨{¬a},...⟩".
* **State A'1 (bottom-right):** Contains the expression "⟨{a},...⟩".
* **Transition from A1 to A'2:** A downward arrow points from A1 to A'2.
* **Transition from A2 to A'1:** A downward arrow points from A2 to A'1.
* **Transition from A1 to A2:** A curved arrow points from A1 to A2.
* **Transition from A2 to A1:** A curved arrow points from A2 to A1.
### Key Observations
* The diagram illustrates transitions between states based on the presence or absence of a variable 'a' and its negation '¬a'.
* The states A1 and A2 are interconnected with bidirectional transitions.
* The states A'1 and A'2 are terminal states, with no outgoing transitions.
### Interpretation
The diagram represents a system that can exist in one of four states, with transitions between them governed by the presence or absence of a variable 'a' and its negation. The states A1 and A2 represent initial states, while A'1 and A'2 represent derived or final states. The bidirectional transitions between A1 and A2 suggest a cyclical relationship or oscillation between these states. The "..." in A'1 and A'2 suggests that these states may contain additional elements or information not explicitly shown in the diagram.