## Line Chart: Test Accuracy vs. Graph Signal
### Overview
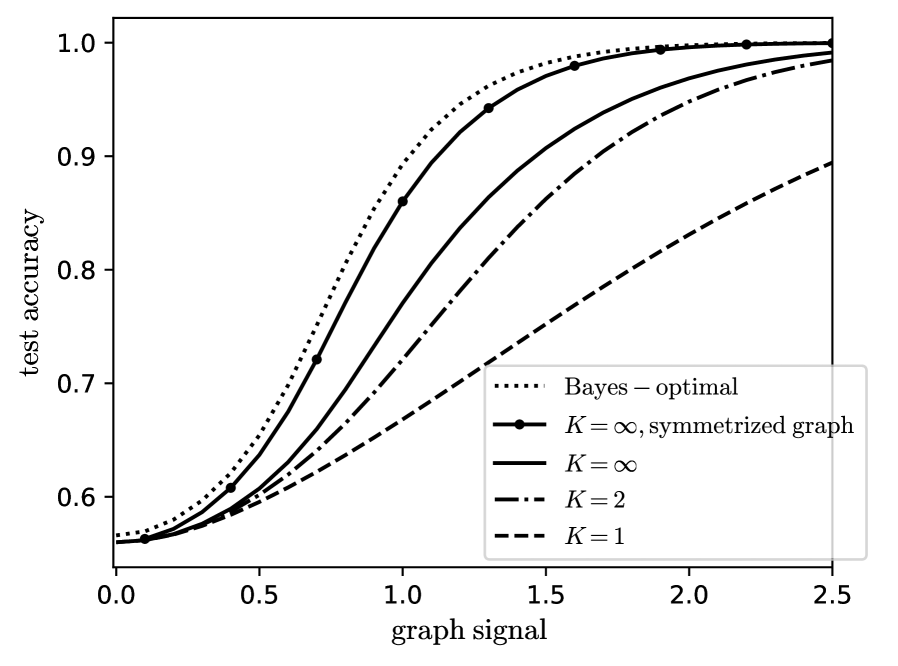
The image is a line chart comparing the test accuracy of different graph-based models as a function of the graph signal. The chart displays the performance of models with varying values of K (a parameter related to the graph structure) against a Bayes-optimal benchmark.
### Components/Axes
* **X-axis:** "graph signal", ranging from 0.0 to 2.5 in increments of 0.5.
* **Y-axis:** "test accuracy", ranging from 0.6 to 1.0 in increments of 0.1.
* **Legend:** Located in the bottom-right corner, it identifies the different lines:
* Dotted line: "Bayes - optimal"
* Solid line with markers: "K = ∞, symmetrized graph"
* Solid line: "K = ∞"
* Dash-dotted line: "K = 2"
* Dashed line: "K = 1"
### Detailed Analysis
* **Bayes - optimal (dotted line):** Starts at approximately 0.56 at graph signal 0.0, rises sharply, and plateaus near 1.0 around a graph signal of 1.5.
* (0.0, 0.56), (0.5, 0.72), (1.0, 0.86), (1.5, 0.97), (2.0, 0.99), (2.5, 1.0)
* **K = ∞, symmetrized graph (solid line with markers):** Starts at approximately 0.56 at graph signal 0.0, rises sharply, and plateaus near 1.0 around a graph signal of 2.0.
* (0.0, 0.56), (0.5, 0.61), (1.0, 0.78), (1.5, 0.92), (2.0, 0.98), (2.5, 0.99)
* **K = ∞ (solid line):** Starts at approximately 0.56 at graph signal 0.0, rises steadily, and approaches 1.0 around a graph signal of 2.5.
* (0.0, 0.56), (0.5, 0.60), (1.0, 0.72), (1.5, 0.85), (2.0, 0.94), (2.5, 0.98)
* **K = 2 (dash-dotted line):** Starts at approximately 0.56 at graph signal 0.0, rises steadily, and reaches approximately 0.95 at graph signal 2.5.
* (0.0, 0.56), (0.5, 0.58), (1.0, 0.67), (1.5, 0.78), (2.0, 0.88), (2.5, 0.95)
* **K = 1 (dashed line):** Starts at approximately 0.56 at graph signal 0.0, rises almost linearly, and reaches approximately 0.89 at graph signal 2.5.
* (0.0, 0.56), (0.5, 0.58), (1.0, 0.64), (1.5, 0.72), (2.0, 0.81), (2.5, 0.89)
### Key Observations
* The "Bayes - optimal" model achieves the highest test accuracy for any given graph signal.
* As K increases, the test accuracy generally improves.
* The "K = ∞, symmetrized graph" model performs very close to the "Bayes - optimal" model.
* The "K = 1" model has the lowest test accuracy among the models tested.
* All models start with similar test accuracy at a graph signal of 0.0.
* All models show increasing test accuracy as the graph signal increases.
### Interpretation
The chart demonstrates the relationship between graph signal strength and test accuracy for different graph-based models. The results suggest that increasing the value of K, which likely corresponds to increasing the complexity or connectivity of the graph, generally improves the model's performance. The "Bayes - optimal" line represents an upper bound on performance, and the models with higher K values approach this bound more closely. The symmetrized graph version of K=infinity performs very close to the Bayes optimal. The model with K=1 performs the worst, suggesting that a more complex graph structure is beneficial for achieving higher test accuracy. The fact that all models start at the same accuracy for a graph signal of 0.0 suggests that the graph structure is not informative when the signal is weak.